Accounting is the language of business.
If you buy stocks, you MUST learn how to read a Cash Flow Statement.
Here’s everything you need to know:
If you buy stocks, you MUST learn how to read a Cash Flow Statement.
Here’s everything you need to know:
The cash flow statement shows how cash moves in and out of a company over a period of time.
The most common time periods are:
▪️1 Quarter
▪️1 Year
▪️Year-to-date (usually 6 or 9 months)
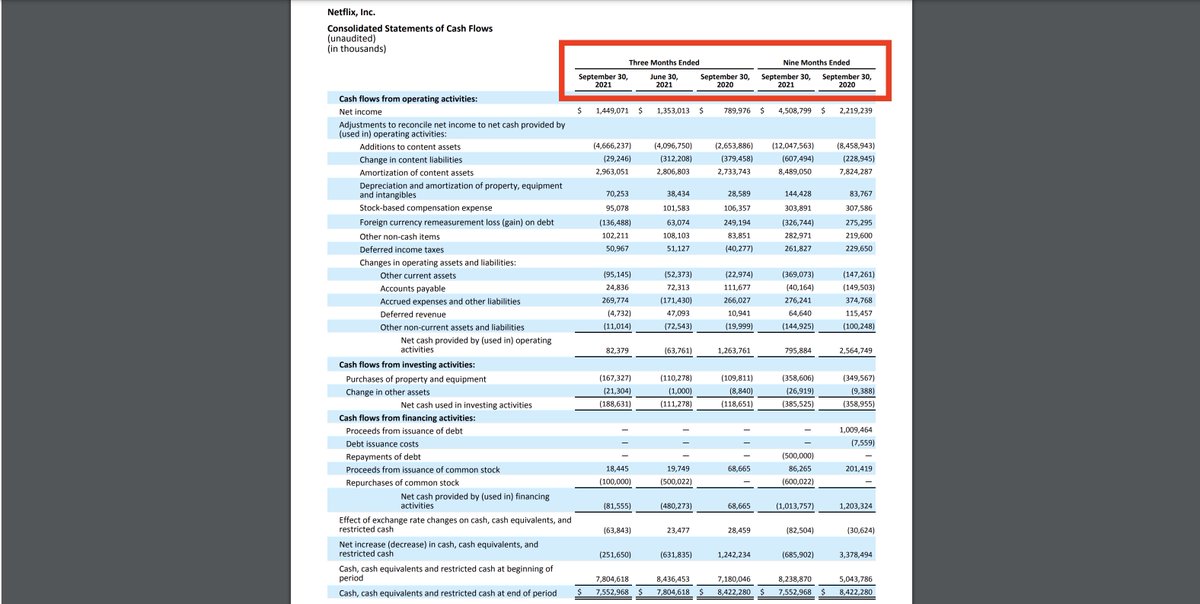
The time period is at the top. Here's $NFLX recent cash flow statement time period.
The most common time periods are:
▪️1 Quarter
▪️1 Year
▪️Year-to-date (usually 6 or 9 months)
The time period is at the top. Here's $NFLX recent cash flow statement time period.
Some companies show the cash flow statement in their earnings press release, but many don’t.
You can find the cash flow statement by looking at:
▪️10-Q (Quarterly Report)
▪️10-K (Annual Report)
▪️Fnancial aggregators such as @theTIKR,
@CMLviz, @themotleyfool, @YahooFinance
You can find the cash flow statement by looking at:
▪️10-Q (Quarterly Report)
▪️10-K (Annual Report)
▪️Fnancial aggregators such as @theTIKR,
@CMLviz, @themotleyfool, @YahooFinance

There are three main segments to a cash flow statement.
1. Operating Activities
2. Investing Activities
3. Financing Activities
Companies get some leeway with how they breakout each segment, but they all follow this basic structure.
1. Operating Activities
2. Investing Activities
3. Financing Activities
Companies get some leeway with how they breakout each segment, but they all follow this basic structure.
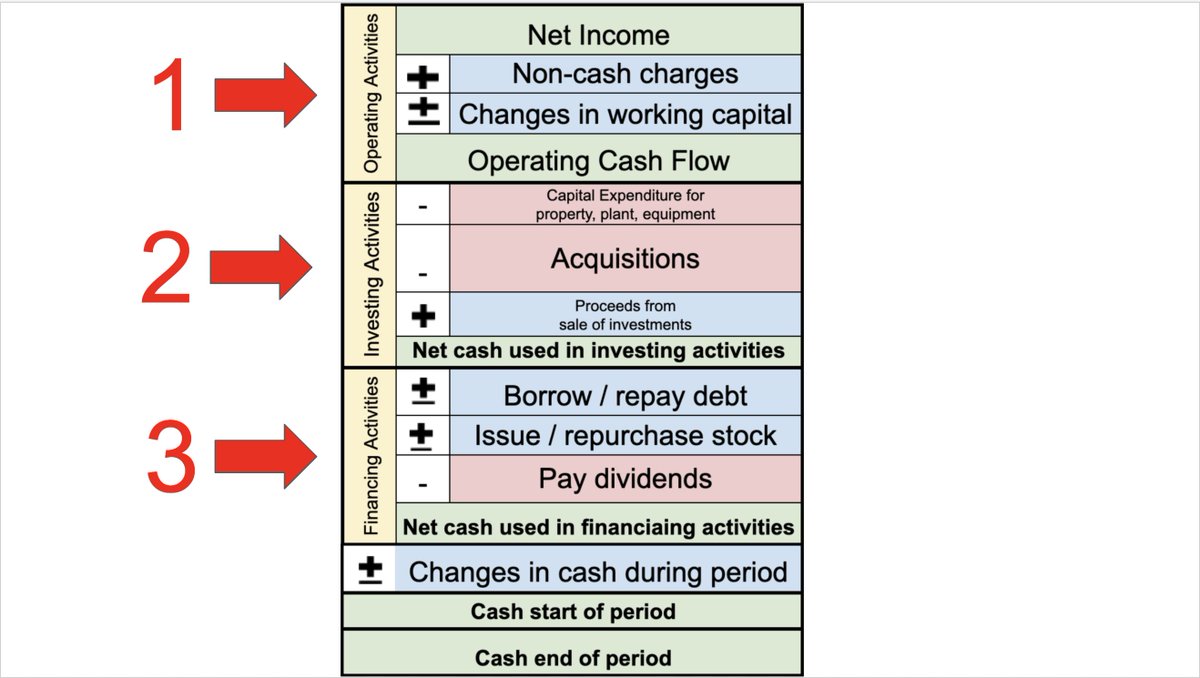
Let’s start with Operating Activities.
This segment STARTS with net income (the bottom number of the Income Statement).
It shows cash movements from all normal operational business activities.
This segment STARTS with net income (the bottom number of the Income Statement).
It shows cash movements from all normal operational business activities.

Non-cash expenses are ADDED back as a source of cash.
Common categories:
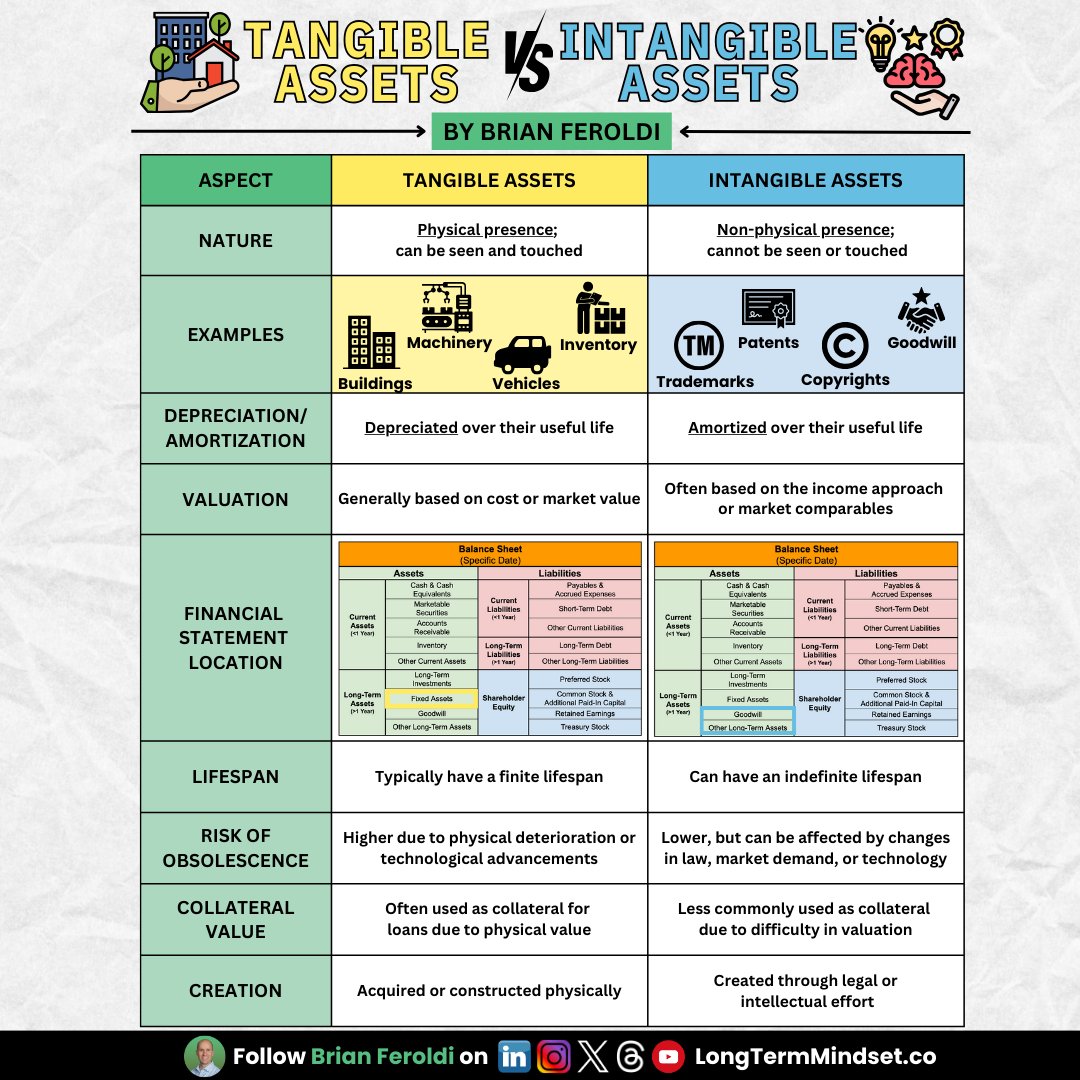
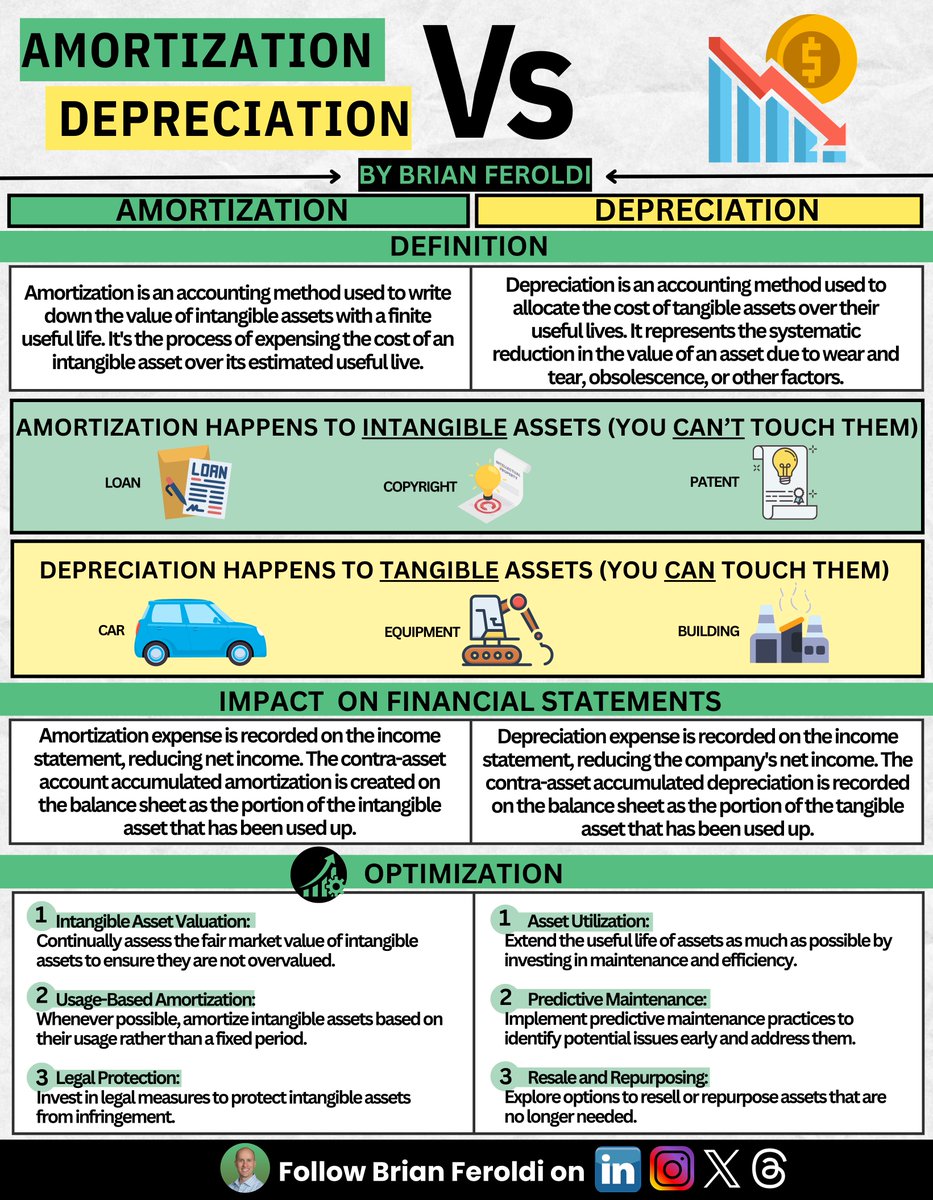
▪️Depreciation: Value of asset decreasing over time
▪️Amortization: Expensing a pre-paid cost over time
▪️Stock-Based Comp: Paying employees with equity
Common categories:
▪️Depreciation: Value of asset decreasing over time
▪️Amortization: Expensing a pre-paid cost over time
▪️Stock-Based Comp: Paying employees with equity

Next is Working Capital, which can ADD or SUBTRACT from cash flow:
Categories:
▪️Accounts Receivable: Sales that haven't been collected yet
▪️Accounts Payable: Bills that haven't been paid yet
▪️Inventory: Value of product you haven’t sold yet
Categories:
▪️Accounts Receivable: Sales that haven't been collected yet
▪️Accounts Payable: Bills that haven't been paid yet
▪️Inventory: Value of product you haven’t sold yet

Once all cash adjustments are made, the net is a company’s Operating Cash Flow.
Think of this number like a company’s Net Income, but in actual cash.
Think of this number like a company’s Net Income, but in actual cash.

The next section is called Cash Flows from Investing Activities.
The shows the cash gains and losses from investments the business has made.
The shows the cash gains and losses from investments the business has made.

Categories:
▪️Capital Expenditure (CAPEX): Money spent to acquire/maintain physical assets such as property, plants, buildings, or equipment.
▪️Acquisitions: buying another company
▪️Proceeds from sale of investments: Cash recieved from selling CAPEX or acquisitions
▪️Capital Expenditure (CAPEX): Money spent to acquire/maintain physical assets such as property, plants, buildings, or equipment.
▪️Acquisitions: buying another company
▪️Proceeds from sale of investments: Cash recieved from selling CAPEX or acquisitions
We can now calculate Free Cash Flow (FCF)!
FCF is the cash that is left after a company has paid for its Operating Expenses and CAPEX.
Many investors (myself included) consider this to be a superior way to calculate a company’s actual profitability.
FCF is the cash that is left after a company has paid for its Operating Expenses and CAPEX.
Many investors (myself included) consider this to be a superior way to calculate a company’s actual profitability.

Section 3 is Cash Flows From Financing Activities.
This measures the cash movements between a company and its owners (shareholders) and its creditors (bondholders).
This measures the cash movements between a company and its owners (shareholders) and its creditors (bondholders).

Common categories:
▪️Debt: Cash gained/lost from borrowing/repaying debt
▪️Stock: Cash gained/lost from issuing/repurchasing stock
▪️Dividends: Cash payments to shareholders
▪️Debt: Cash gained/lost from borrowing/repaying debt
▪️Stock: Cash gained/lost from issuing/repurchasing stock
▪️Dividends: Cash payments to shareholders
The final section shows the total changes in cash balance during the period.
Its shows:
1⃣Sum of Operating Activities + Investing Activities + Financing Activities
2⃣Starting Cash Balance
3⃣Ending Cash Balance
Its shows:
1⃣Sum of Operating Activities + Investing Activities + Financing Activities
2⃣Starting Cash Balance
3⃣Ending Cash Balance

The cash flow statement is complex.
Watching an example is VERY helpful
@brian_stoffel_ and I made a YouTube video about the cash flow statement that uses $NFLX as an example
Watch it here:
Watching an example is VERY helpful
@brian_stoffel_ and I made a YouTube video about the cash flow statement that uses $NFLX as an example
Watch it here:
Enjoy this thread?
Follow me @BrianFeroldi
I regularly tweet about money, investing, and personal growth
Follow me @BrianFeroldi
I regularly tweet about money, investing, and personal growth
Want to learn how to invest?
Subscribe to my YouTube channel.
We teach investors how to research stocks & the most important investing lessons we've ever learned.
youtube.com/brianferoldiyt…
Subscribe to my YouTube channel.
We teach investors how to research stocks & the most important investing lessons we've ever learned.
youtube.com/brianferoldiyt…
If this thread was helpful, you’ll also enjoy my thread on how to read an income statement
https://twitter.com/BrianFeroldi/status/1420377260222296066?s=20
Finally, here’s my thread on how to read a balance sheet
Happy investing!
Happy investing!
https://twitter.com/BrianFeroldi/status/1443598989526450182?s=20
• • •
Missing some Tweet in this thread? You can try to
force a refresh