Advanced Astro
Sun conjunct Nodes of Moon (so always near eclipses)
What is the actual data?
Sun conjunct Nodes of Moon (so always near eclipses)
What is the actual data?
SPX 1945-current for more history
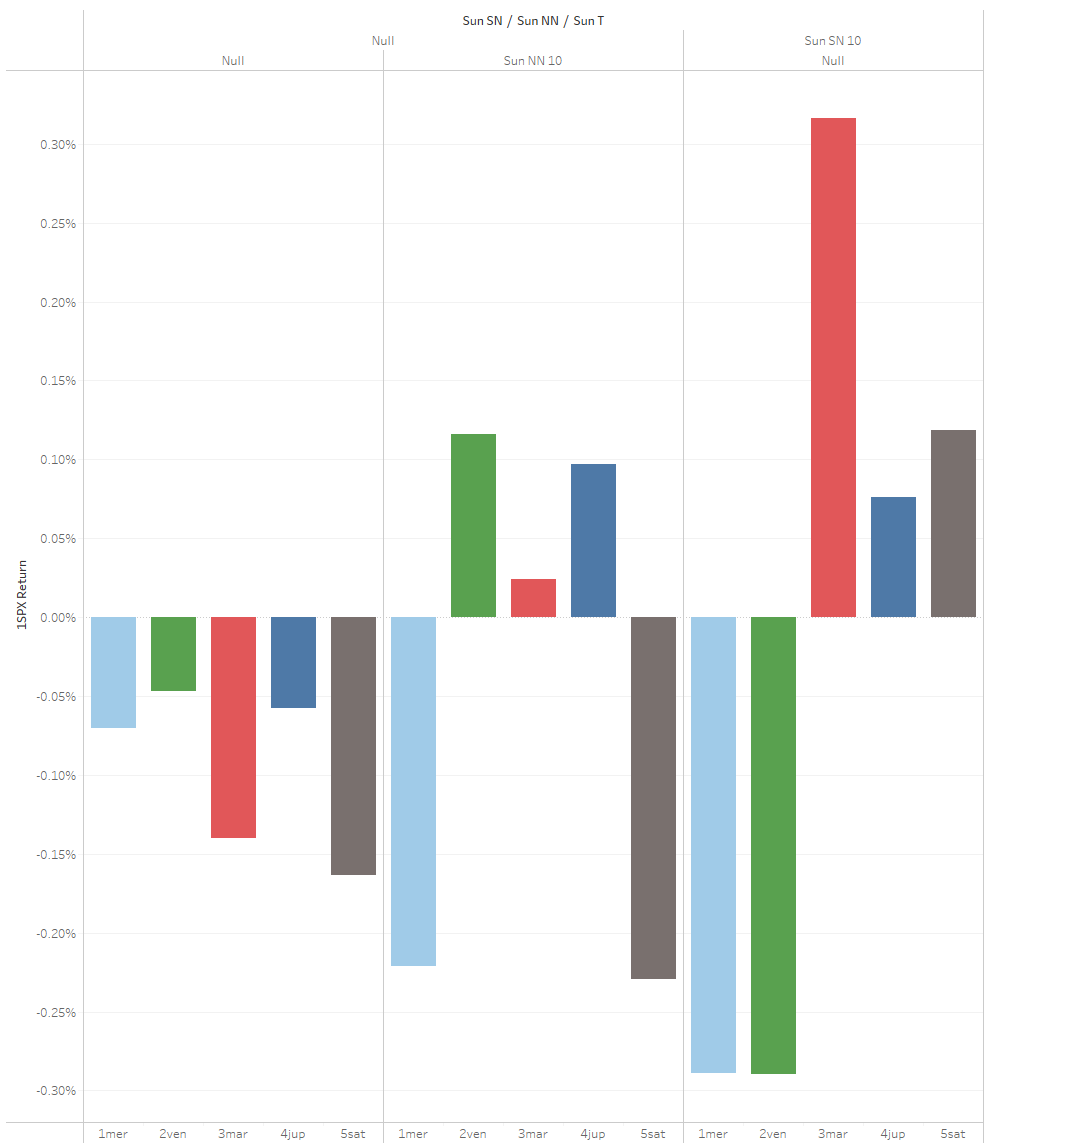
All markets to start
Left bar all other times
Middle bar Sun cnj NN 10' applying
Right bar Sun cnj SN 10' applying
I doubt most would have expected actually Sun cnj SN better than average! Sun cnj NN slightly under normal result.
All markets to start
Left bar all other times
Middle bar Sun cnj NN 10' applying
Right bar Sun cnj SN 10' applying
I doubt most would have expected actually Sun cnj SN better than average! Sun cnj NN slightly under normal result.

Bull markets only
All other times takes over as best, SN 2nd, NN 3rd
Not much difference between all other times and Sun cnj SN
All other times takes over as best, SN 2nd, NN 3rd
Not much difference between all other times and Sun cnj SN

SPX 1945-current
Bull markets only
Adding Sun element - now getting somewhere
Sun cnj NN in fire did well, but negative in water! Negative results in bull markets are rare.
Sun cnj SN in earth was strongest, and cnj SN in water also did fine. Sun cnj SN in fire down!
Bull markets only
Adding Sun element - now getting somewhere
Sun cnj NN in fire did well, but negative in water! Negative results in bull markets are rare.
Sun cnj SN in earth was strongest, and cnj SN in water also did fine. Sun cnj SN in fire down!

We can also see the dispersion of results compared to "Null" meaning normal times, Sun cnj SN is pretty wild
But this also happens with a lot of events with low incidence
But this also happens with a lot of events with low incidence
Same study
SPX 1945-current
Bull markets only
Segmenting by Sun sign
Null set (left) = all other times
Sun cnj NN middle set
Sun cnj SN right set
Here coloring signs per usual legend
SPX 1945-current
Bull markets only
Segmenting by Sun sign
Null set (left) = all other times
Sun cnj NN middle set
Sun cnj SN right set
Here coloring signs per usual legend

Sun cnj NN in Cap did great
Sun cnj NN in Pisces bombed
Sun cnj SN in Virgo also great
Sun cnj SN in Leo & Aqu both negative
Now to really understand all this we'd have to check the actual events, because low incidence, maybe Saturn cnj Nodes or whatever
Just getting idea here
Sun cnj NN in Pisces bombed
Sun cnj SN in Virgo also great
Sun cnj SN in Leo & Aqu both negative
Now to really understand all this we'd have to check the actual events, because low incidence, maybe Saturn cnj Nodes or whatever
Just getting idea here
SPX 1945-current
Bull markets only
Segmenting by term
Same structure -
Null set all other times to left
Middle set Sun cnj NN
Right set Sun cnj SN
I'm not surprised that these are odd patterns because the nodes are very tricky
Not sure why Sun cnj NN in term of Saturn +++
Bull markets only
Segmenting by term
Same structure -
Null set all other times to left
Middle set Sun cnj NN
Right set Sun cnj SN
I'm not surprised that these are odd patterns because the nodes are very tricky
Not sure why Sun cnj NN in term of Saturn +++

But looking at BEAR markets only, SPX 1945-current
Null set - Saturn & Mars worst data (and much higher incidence)
Middle set - Somehow Venus & Jupiter pulling positive in bear markets, and Merc & Saturn worst - makes sense though
Right set - Sun cnj SN in Mars term, bear rally
Null set - Saturn & Mars worst data (and much higher incidence)
Middle set - Somehow Venus & Jupiter pulling positive in bear markets, and Merc & Saturn worst - makes sense though
Right set - Sun cnj SN in Mars term, bear rally
Next event is Sun cnj SN in Sagittarius (fire sign) term of Jupiter
Sun cnj SN in Fire in bull markets = mild negative
Sun cnj SN in Sag = mild negative
Sun cnj SN in Jupiter term = historically some up
So toss up kinda
Sun cnj SN in Fire in bull markets = mild negative
Sun cnj SN in Sag = mild negative
Sun cnj SN in Jupiter term = historically some up
So toss up kinda
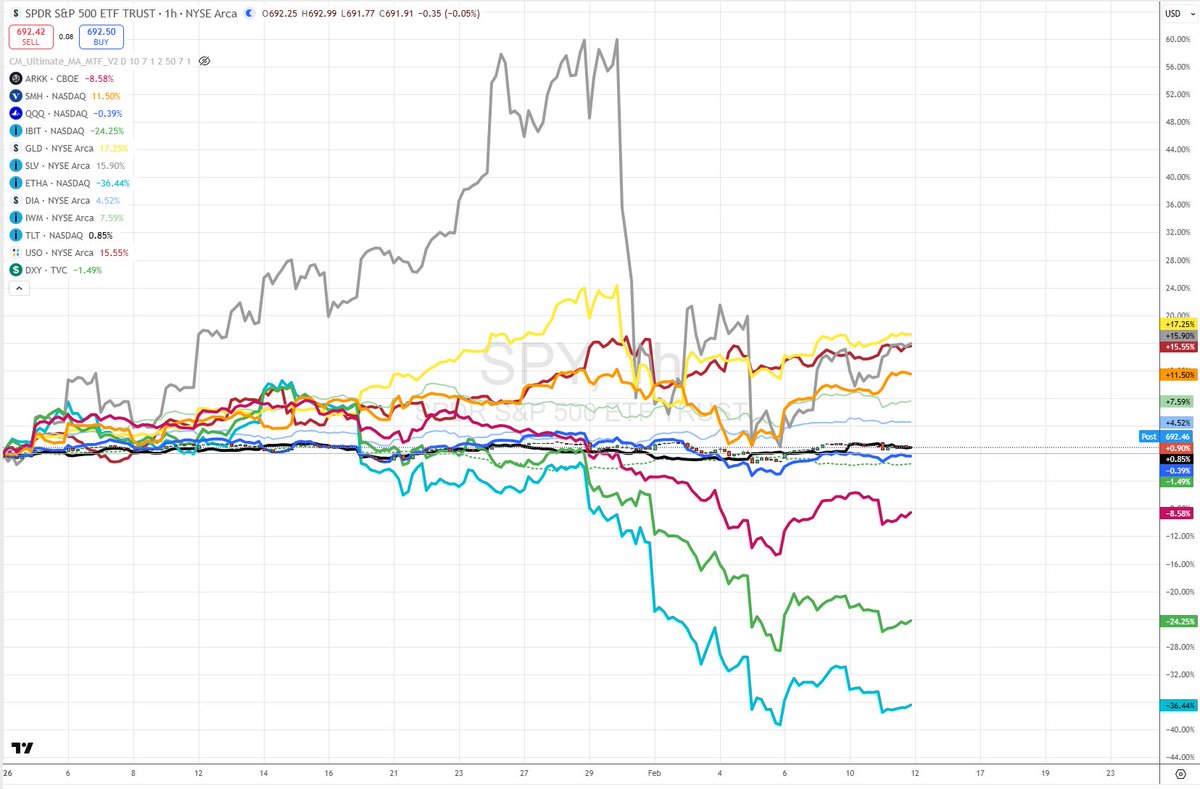
SPX 2018-current
Red = Sun cnj NN 10' applying
Orange = Sun cnj SN 10' applying
Some of these shake up the market! 2018 was very fast drop! But many do not. June 2020 volatility, but Dec 2020 up for minor trading top. Element seems to be a clue.
Red = Sun cnj NN 10' applying
Orange = Sun cnj SN 10' applying
Some of these shake up the market! 2018 was very fast drop! But many do not. June 2020 volatility, but Dec 2020 up for minor trading top. Element seems to be a clue.

Back to next Sun cnj SN within 10'
The tricky thing is
SN (mean) is at 1 Sag looks fine
But 10' applying includes a lot of Scorpio
Esp those last 6' ...
That is actually valid down pressure, just per Sun through term data
That's it for now but something to keep in mind ahead
The tricky thing is
SN (mean) is at 1 Sag looks fine
But 10' applying includes a lot of Scorpio
Esp those last 6' ...
That is actually valid down pressure, just per Sun through term data
That's it for now but something to keep in mind ahead
unroll @threadreaderapp
• • •
Missing some Tweet in this thread? You can try to
force a refresh