Coinbase $COIN 3Q21 Earnings💪🏻
- Rev $1.2b +330%🚀 -39% QoQ ↘️
- Adj EBITDA $618m +402%🚀 -46% QoQ ↘️ margin 50% +718bps ✅
- EBIT $291m +187%🚀 margin 22% -994bps ↘️
- Net Income $406m +401%🚀 -25%QoQ ↘️ margin 33% +465bps ✅
- Rev $1.2b +330%🚀 -39% QoQ ↘️
- Adj EBITDA $618m +402%🚀 -46% QoQ ↘️ margin 50% +718bps ✅
- EBIT $291m +187%🚀 margin 22% -994bps ↘️
- Net Income $406m +401%🚀 -25%QoQ ↘️ margin 33% +465bps ✅

$COIN Key Biz Metrics ⬆️YoY ↘️QoQ
- Txn Rev $1.1b +295% 🚀 -44% QoQ ↘️
- Retail $1.0b +289% 🚀-44% QoQ ↘️
- Insti $68m +409% 🚀 -34% QoQ ↘️
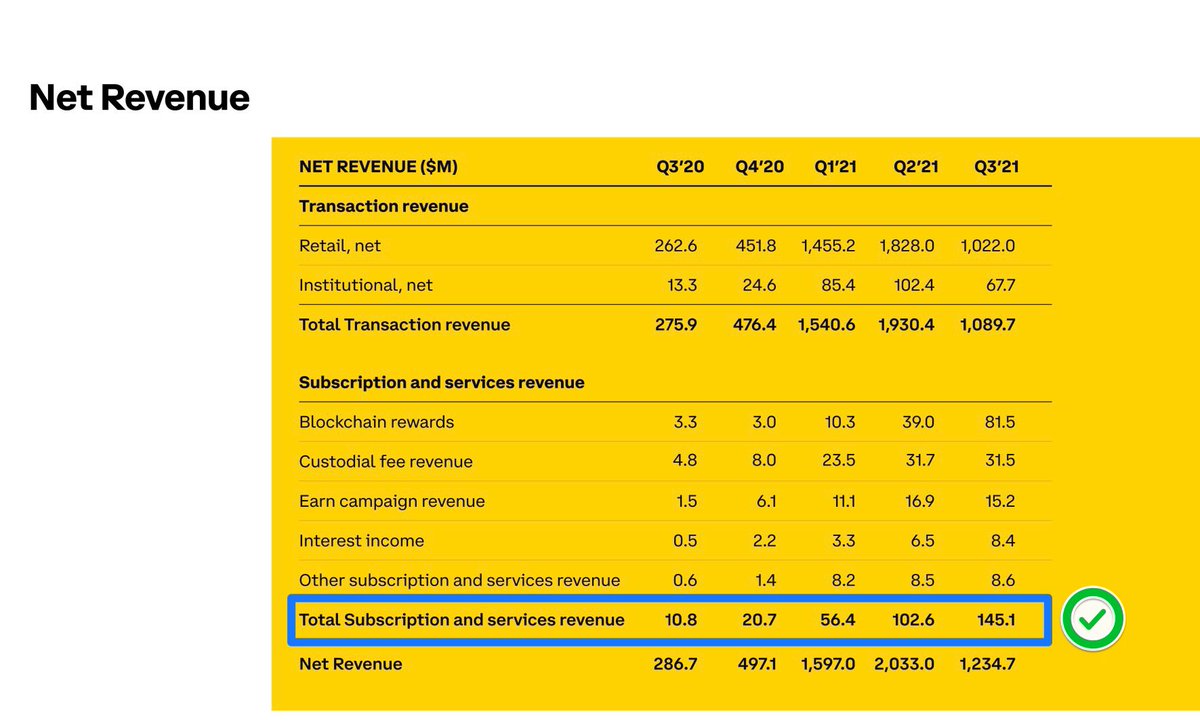
- Sub Rev $145m +12X 🚀 + 41% QoQ ↗️✅
- MTU 7.4m +252% 🚀-16%QoQ ↘️
- Vol $327b +627% 🚀 -29% QoQ ↘️
- AOP $255b +608% 🚀 +42%QoQ ↗️✅⭐️
- Txn Rev $1.1b +295% 🚀 -44% QoQ ↘️
- Retail $1.0b +289% 🚀-44% QoQ ↘️
- Insti $68m +409% 🚀 -34% QoQ ↘️
- Sub Rev $145m +12X 🚀 + 41% QoQ ↗️✅
- MTU 7.4m +252% 🚀-16%QoQ ↘️
- Vol $327b +627% 🚀 -29% QoQ ↘️
- AOP $255b +608% 🚀 +42%QoQ ↗️✅⭐️
⭐️“We told you before, we want to be the Amazon of assets…”
AOP 📶
- Total $255n +6X 🚀+58%QoQ
- Retail $116b +5X 🚀+32% QoQ
- Insti $139b +7X 🚀 +51%QoQ
AOP (% of Total)
- BTC 42% continues to decline 📉✅
- ETH 22% (⬇️ vs 2Q21 24%) 📉✅
- Others 33% (⬆️ vs 2Q21 25%) 📈✅
AOP 📶
- Total $255n +6X 🚀+58%QoQ
- Retail $116b +5X 🚀+32% QoQ
- Insti $139b +7X 🚀 +51%QoQ
AOP (% of Total)
- BTC 42% continues to decline 📉✅
- ETH 22% (⬇️ vs 2Q21 24%) 📉✅
- Others 33% (⬆️ vs 2Q21 25%) 📈✅

✅ Rising Market Share of Assets (AOP)
Coinbase Crypto Assets ~12.2% of total crypto market cap (vs 11.2% in 2Q21) +100bps market share
Trading Volume
- Total $327b +626% 🚀 -29%QoQ ↘️❌
- Retail $93b +416% 🚀 -36% QoQ ↘️❌
- Insti $234b +1074%-26%QoQ ↘️❌
Coinbase Crypto Assets ~12.2% of total crypto market cap (vs 11.2% in 2Q21) +100bps market share
Trading Volume
- Total $327b +626% 🚀 -29%QoQ ↘️❌
- Retail $93b +416% 🚀 -36% QoQ ↘️❌
- Insti $234b +1074%-26%QoQ ↘️❌

Trading Volume (% of Total) - Diversification
- BTC 19% continues to decline 📉✅
- ETH 22% (lower vs 2Q21 26%) 📉✅
- Others 59% (higher vs 2Q21 50%) 📈✅
Txn Revenue - Diversification
- BTC 21% continues to decline📉✅
- ETH 22% (⬇️ vs 2Q21)📉✅
- Others 57% (⬆️ vs 2Q21)📈✅
- BTC 19% continues to decline 📉✅
- ETH 22% (lower vs 2Q21 26%) 📉✅
- Others 59% (higher vs 2Q21 50%) 📈✅
Txn Revenue - Diversification
- BTC 21% continues to decline📉✅
- ETH 22% (⬇️ vs 2Q21)📉✅
- Others 57% (⬆️ vs 2Q21)📈✅
Rising Crypto Adoption 📶

Rising Users that have higher Engagement

Rising Custoday Assets and Trading Assets

1 | Four Main Areas of Focus
1) Products (retail, prime app, cloud, NFT)
2) Customer Service (24/7 support)
3) Site reliability (adequate uptime)
4) Regulation (being the most trusted, getting licenses)
1) Products (retail, prime app, cloud, NFT)
2) Customer Service (24/7 support)
3) Site reliability (adequate uptime)
4) Regulation (being the most trusted, getting licenses)
2 | Volumes - Institutional ↗️ Retail ➡️
“Trading volume across the entire crypto spot market declined quarter-over-quarter in Q3.” ↘️
“…our institutional volume outperformed this broader market…↗️
and our retail volumes performed in line with the industry.” ➡️
“Trading volume across the entire crypto spot market declined quarter-over-quarter in Q3.” ↘️
“…our institutional volume outperformed this broader market…↗️
and our retail volumes performed in line with the industry.” ➡️
3 | Txn Fee Rates - Mix Dependent
“the blended average fee rates were lower in Q3 versus Q2 for our retail business” ↘️
“…we haven't changed our fee structure in Q3 and haven't in some time. ➡️
“the blended average fee rates were lower in Q3 versus Q2 for our retail business” ↘️
“…we haven't changed our fee structure in Q3 and haven't in some time. ➡️
3 | Txn Fee Rates (cont’d)
…the weighted average fee vary QoQ depending on the mix…more volume from our Pro platform than our consumer…
…common in periods of low volatility…high activity remain under our institutions in our Pro users and retail vs the consumer trading...”
…the weighted average fee vary QoQ depending on the mix…more volume from our Pro platform than our consumer…
…common in periods of low volatility…high activity remain under our institutions in our Pro users and retail vs the consumer trading...”
4 | Amazon of Cryptoassets
“We told you before, we want to be the Amazon of assets…”
“We told you before, we want to be the Amazon of assets…”
5 | Rethink Coinbase
“… think about Coinbase…makes things as usable as possible for our many customers, …crypto native… able to offer many more assets and many more crypto native features, such as staking, rewards, borrow, earn, because of our exclusive focus on crypto.”
“… think about Coinbase…makes things as usable as possible for our many customers, …crypto native… able to offer many more assets and many more crypto native features, such as staking, rewards, borrow, earn, because of our exclusive focus on crypto.”
6 | Strength of Subscription & Svcs
“our subscription and services revenue was strong at $145m + 41% 2Q21 QoQ….encouraging sign the crypto is increasingly moving to utility, particularly with these cases around yield and rewards.”
“our subscription and services revenue was strong at $145m + 41% 2Q21 QoQ….encouraging sign the crypto is increasingly moving to utility, particularly with these cases around yield and rewards.”
7 | Timing on Launch of NFTs - 2022?
“We want to make sure our NFT platform is interoperable with every other platform out there and hopefully we'll see something launched in the next couple of quarters here.”
“We want to make sure our NFT platform is interoperable with every other platform out there and hopefully we'll see something launched in the next couple of quarters here.”
8 | Competition - Beyond Fees
“…we don't think of ourselves as primarily competing on fees today as we believe the services that we are providing are not commoditized”
“…we don't think of ourselves as primarily competing on fees today as we believe the services that we are providing are not commoditized”
9 | Competition - Retail
“…retail side, we compete on access to assets…focus on products that allow our users to use their crypto at an increasingly ability to more seamlessly interact with DeFi…providing…a platform…unique & differentiated amongst a lot of our competitors.”
“…retail side, we compete on access to assets…focus on products that allow our users to use their crypto at an increasingly ability to more seamlessly interact with DeFi…providing…a platform…unique & differentiated amongst a lot of our competitors.”
10 | Competition - Institutional
“…institutional side, we're competing against the product suite as well where we offer an institutional grade prime broker, deep liquidity. We offer secure storage to our custom solution. So fees is not the primary aspects that we compete on.”
“…institutional side, we're competing against the product suite as well where we offer an institutional grade prime broker, deep liquidity. We offer secure storage to our custom solution. So fees is not the primary aspects that we compete on.”
➡️ Final Takeaways on Coinbase $COIN:
Expect QoQ volatility, but long-term ↗️. Owning the toll booth & custodian, a rare combination of rapid growth, scale, optionality, profitability, with stickiness & high switching costs (growing AOP, mkt share assets), with regulatory moat.
Expect QoQ volatility, but long-term ↗️. Owning the toll booth & custodian, a rare combination of rapid growth, scale, optionality, profitability, with stickiness & high switching costs (growing AOP, mkt share assets), with regulatory moat.
• • •
Missing some Tweet in this thread? You can try to
force a refresh