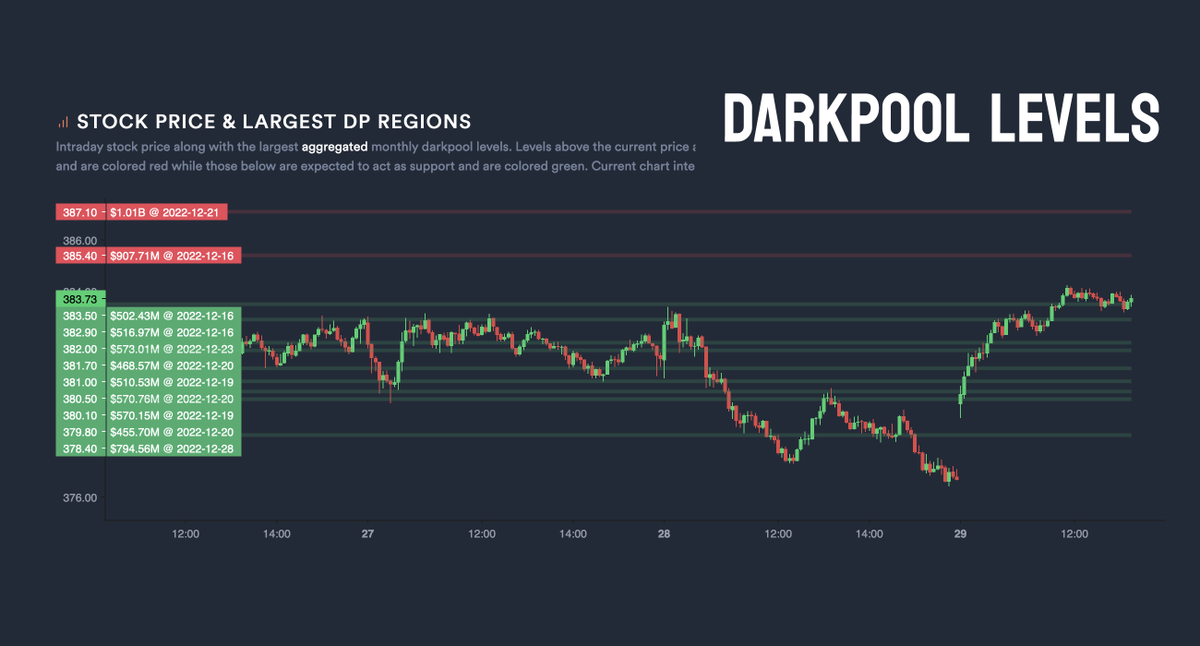
1. Go to Scany 2. Select "Inside Days". 7 day change should be positive 3. Select your watchlist
Let's discuss a couple names from my watchlist. Please learn this on your own, you don't need others.
$BA
$F
$MARA
$TLRY
$COIN
$RBLX
$ARKK
For bullish setups, we generally want all 1 day, 7 day, and 30 day change to be positive because that provides us full time frame continuity and better setups with higher probability.
For bearish, it's the complete opposite
With that out of the way, let's talk about some setups
$ARKK inside day - we have an AVWAP support which if we can respect will send the price upwards.
Calls at the break of the high of yesterday's candle, and puts at the break of the low.
Profit targets are high & low of Wednesday's candle.
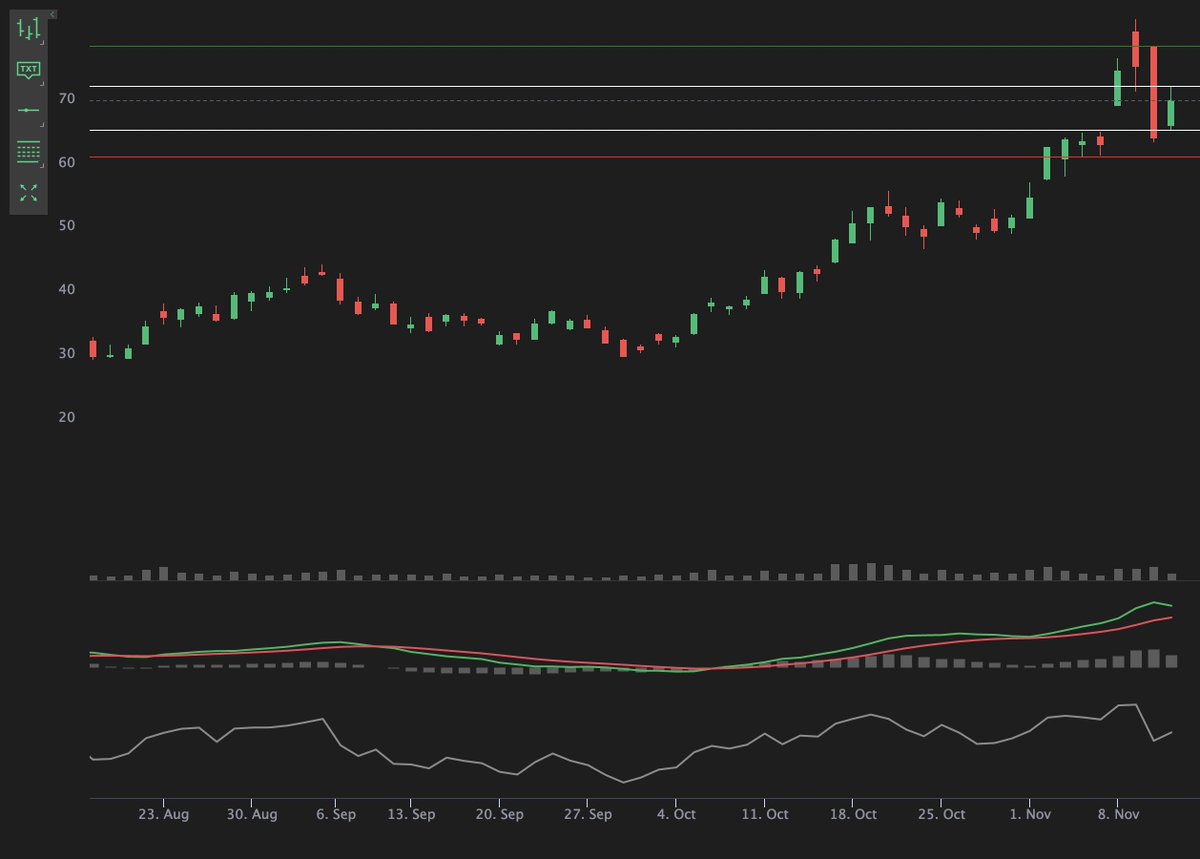
$RBLX this has been very volatile, and on lotto Friday's, more volatility can give us better gains.
Will look for a bullish move since we have full time frame continuity here. If we break the inside candle, some great profits could be there.
Very beautiful inside day here.
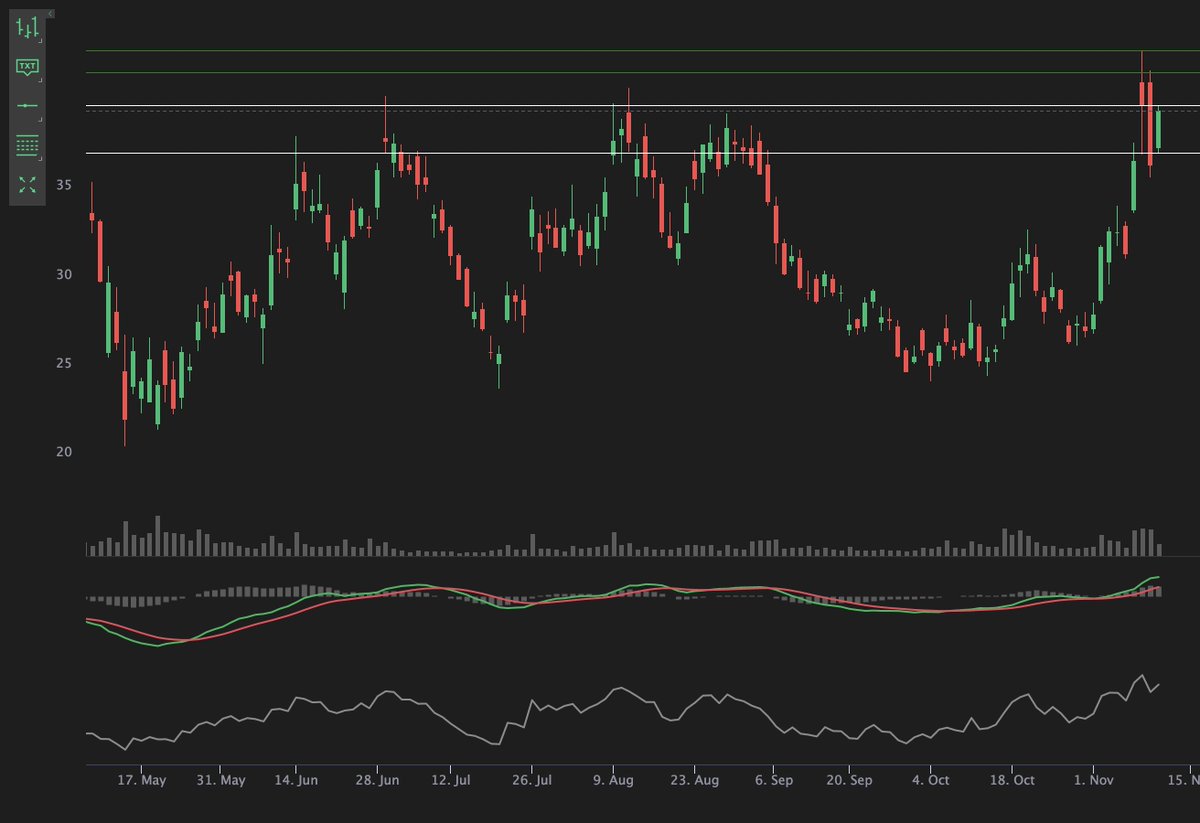
$RIOT $MARA both had inside days. Again, we have bullish time frame continuity here so it would be ideal if we break the high instead of the low.
But both setups are there, to the upside, and to the downside.
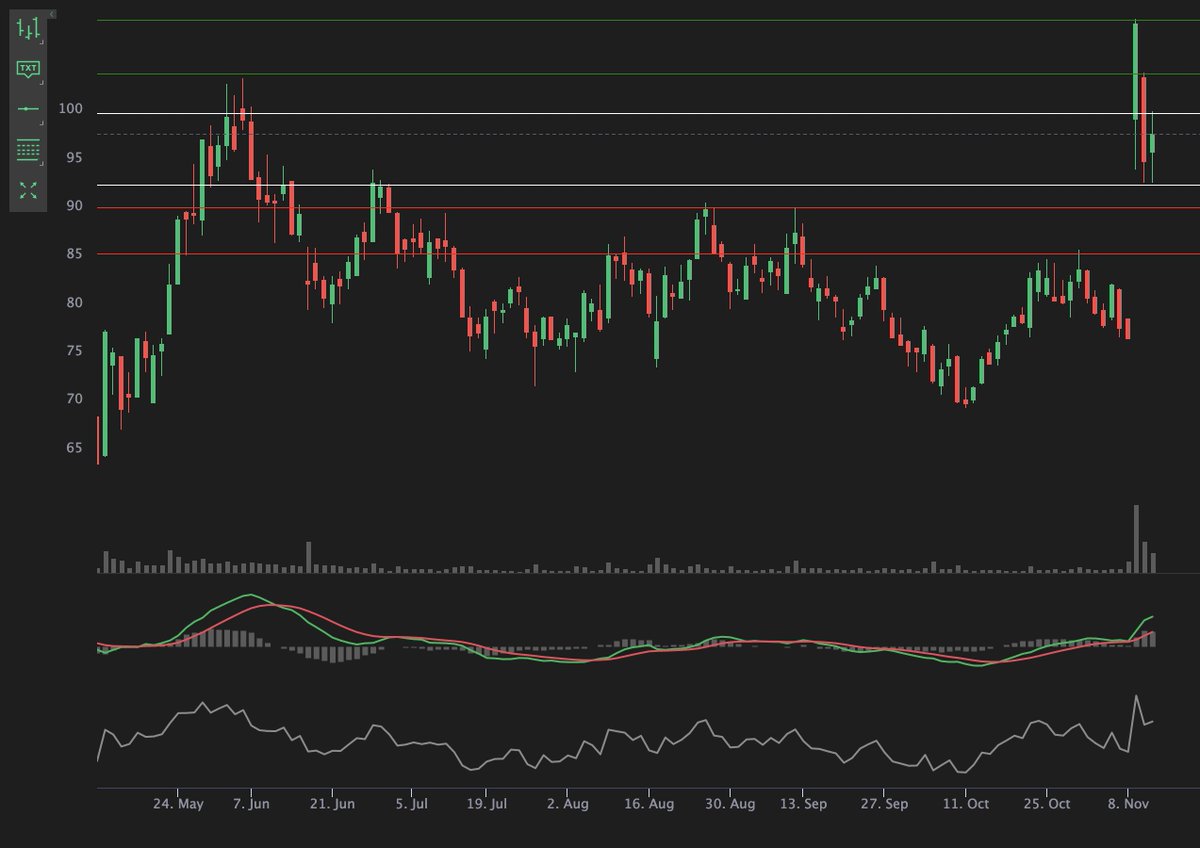
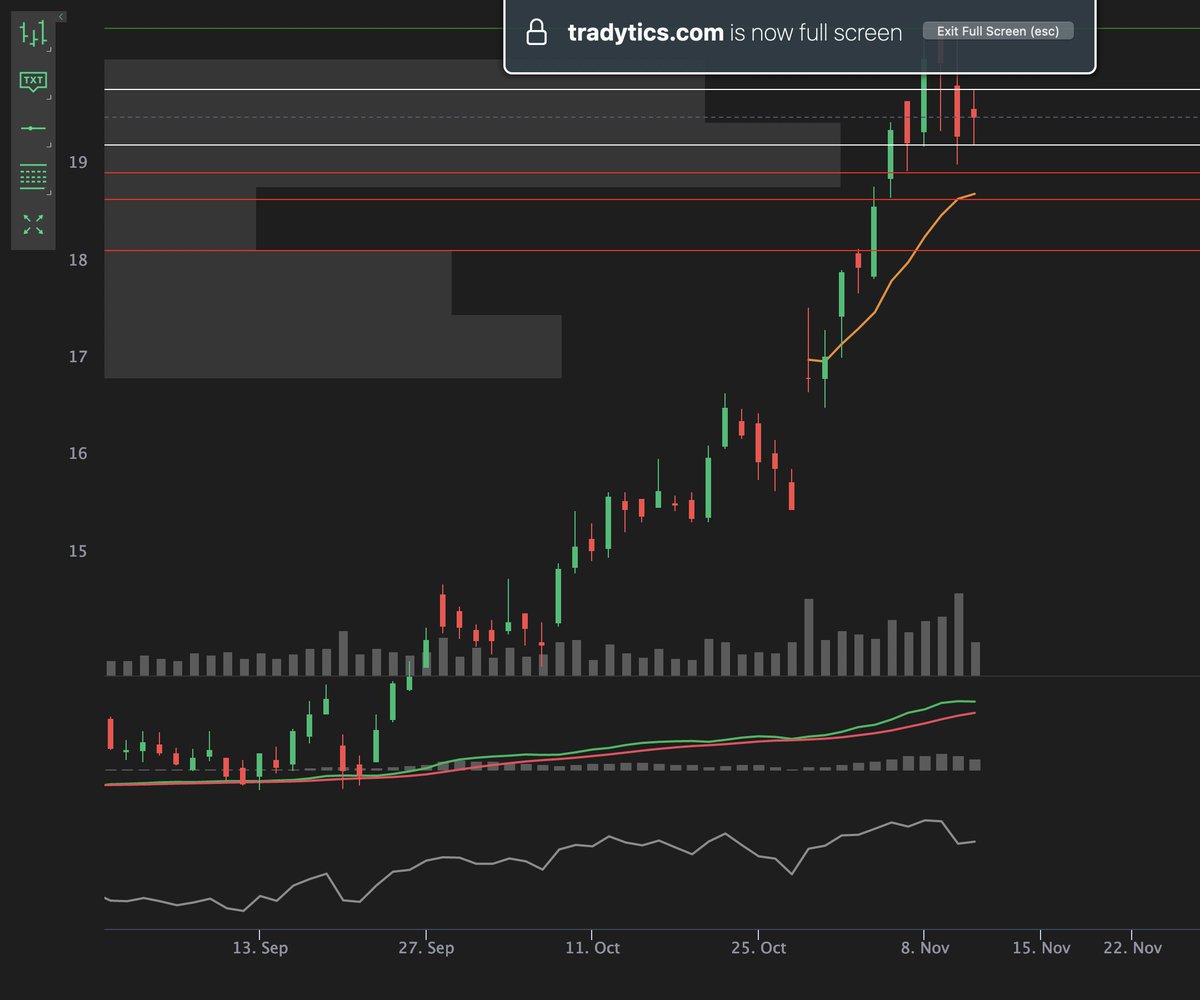
$TLRY really like this one as well - these names have been gaining some momentum and the AVWAP resistance lines well with the potential profit targets here.
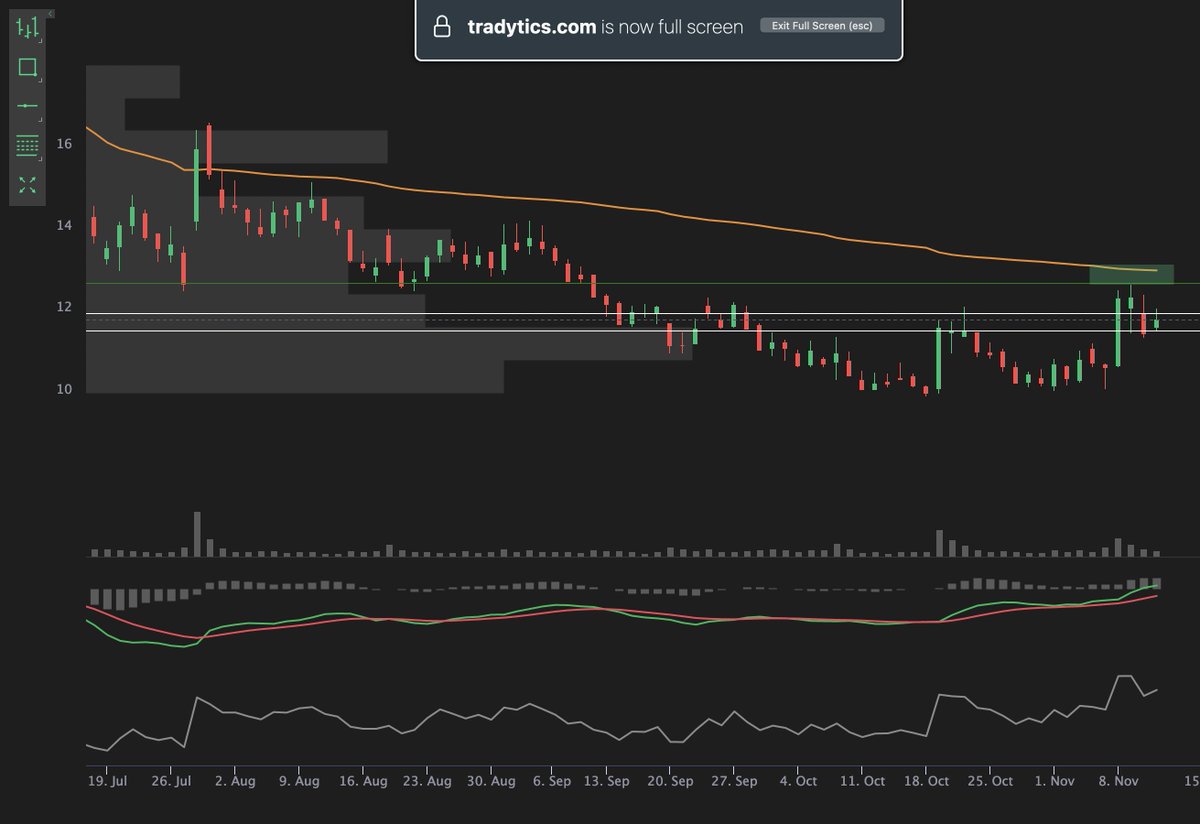
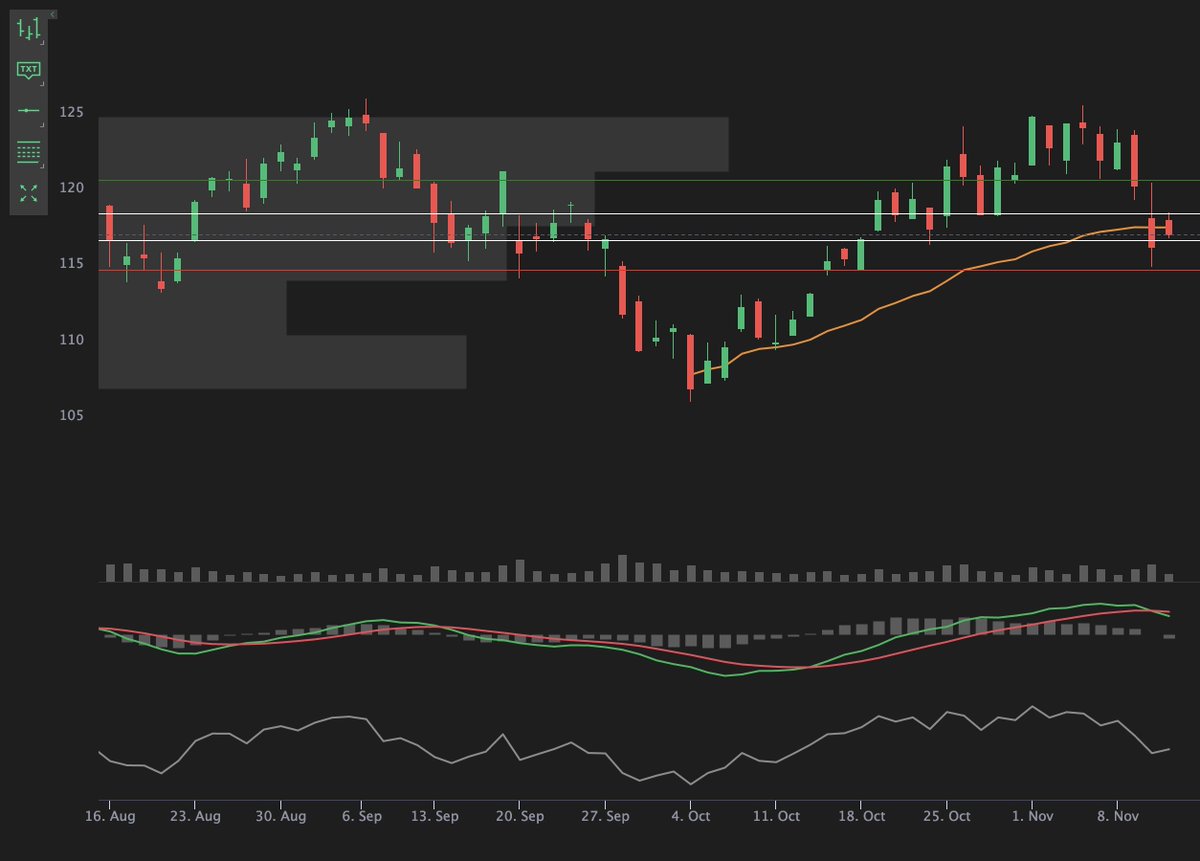
$F final inside day setup - although this has bullish time frame continuity, I would want it to break downwards since MACD is curling and we had a big put Trady Flow yesterday.
But both setups are there, and just like $RBLX, this can give us some volatility.
That's it, hope this was useful. I have never liked relying on others for my plays, and I'd like all of our users to do the same. You have all the data you need, put in time and find your plays.
If you liked this, please don't forget to give us a follow at @Tradytics 🙏
• • •
Missing some Tweet in this thread? You can try to
force a refresh
Introducing community plays aka plays of the week 🎉
Testing out the feature for this week, we’ll track our users and eventually build this into a more robust tool with user stats. Let’s see who’s the best! A lot more prizes in the future, get your submission in.
Why do darkpool levels work? and why do we care about them? A thread 🧵
You might have seen many of recent posts on DP levels & how well they could work as support / resistance levels. Why is that?
DP trades are filled off exchange at different price levels by big/smart parties
Let's assume we have a big darkpool level at 385, what happens when we reach towards that level from below 385, we could find some resistance.
Why is that? Because the smart money might go into a losing position if they had a short position at 385, and they'll come to defend!
That defending of price levels is why we hypothesize these levels form support and resistance. The bigger the amount put on a level, the bigger the support or resistance we can expect.
But we never know the direction of a darkpool trade, right? Correct, let's talk about that.
$TSLA drop from 250 all the way to 100 was fully anticipated by flow traders, it's a beauty! Here's a breakdown 🧵
- October start, we started seeing huge amounts of put buying, and call selling, both bearish signs
- Price dropped, but put buyers never stopped, only took profits
- As price dropped, there were occasional selling / profit taking from puts, but the total amount of puts bought has remained extremely high ever since October, look at the right side of the chart, green bars are put buying.
- Even last week, after a big gradual drop, those puts were still way too high, which is why I tweeted about this! Low and behold, what happens this week? A massive 25% drop within a week!
I'm not smart, these flow traders are, and they've made millions of dollars of profits!
$SPY Dark Pools and how I use them. First, each morning I ping the discord bot "Tr-dplevels spy" and apply the larger one's to my chart. Second, watching them each week you'll start to see a pattern. Numbers above/below may grow larger.
CONT:
If you look at the $380 level earlier last week, it was smaller. As the week went on, it grew. When I am watching price action, I'm looking for Dark pools to help indicate a Support or Resistance level. A case could be made that $380 is now a good sized support.
As the sessions progress, you'll start to notice some DP's shrink & some grow larger. At this point you can start to build your thesis of where some potential daily rejections/bounces might happen.
Let's talk about Santa Rally & look at the data to form opinions $SPY $SPX 🧵
1. Darkpools are neutral / slightly bearish. 2. Massive put flow last week, but could also force dealers to unwind & lead to rally on Friday. 3. Neutral / slightly bullish delta correlations!
Cont.
Since we're looking at a very short time frame, the most important data point here is the delta correlations which have gotten a bit positive for the first time in the last few weeks.
There's a tail i.e 5% probability of a 5-7% downward move, apart from that, it looks bullish.
My final takeaway based on the data I am seeing right now - I think we do get a small rally, but if flow remains as it is, the rally wouldn't be super big.
Short week and probabilities are centered around smaller moves (two big bars in the center), I don't expect a huge move.
I don't use the 7 day to make trades, but this is such a beautiful chart to show what's been happening. Flow traders loaded up on calls yesterday, we got the gap up, and now they're unloading all those calls.
Puts are flat! Why? comment below
To me, puts flat shows short term flow traders are not sure about any direction right now, which is why they are taking profits, but they are not buying puts or calls anymore, they're going in cash.
The chart above is 7 day only! Wanted to highlight short term flow.
I am not using it to make a trade, but I'm definitely using it to stay a bit cautious and make smaller plays.