Tradytics Profile picture
We bridge the gap between wall street traders and retail traders by providing you industry-grade data
13 subscribers
Jan 16, 2023 4 tweets 1 min read
Introducing community plays aka plays of the week 🎉

Testing out the feature for this week, we’ll track our users and eventually build this into a more robust tool with user stats. Let’s see who’s the best! A lot more prizes in the future, get your submission in. Image tradytics.com/community-plays

Please do note that we’re still in experimental stage this week, so please report any issues.

Winners will still be announced & paid next week.
Dec 29, 2022 7 tweets 2 min read
Why do darkpool levels work? and why do we care about them? A thread 🧵

You might have seen many of recent posts on DP levels & how well they could work as support / resistance levels. Why is that?

DP trades are filled off exchange at different price levels by big/smart parties 
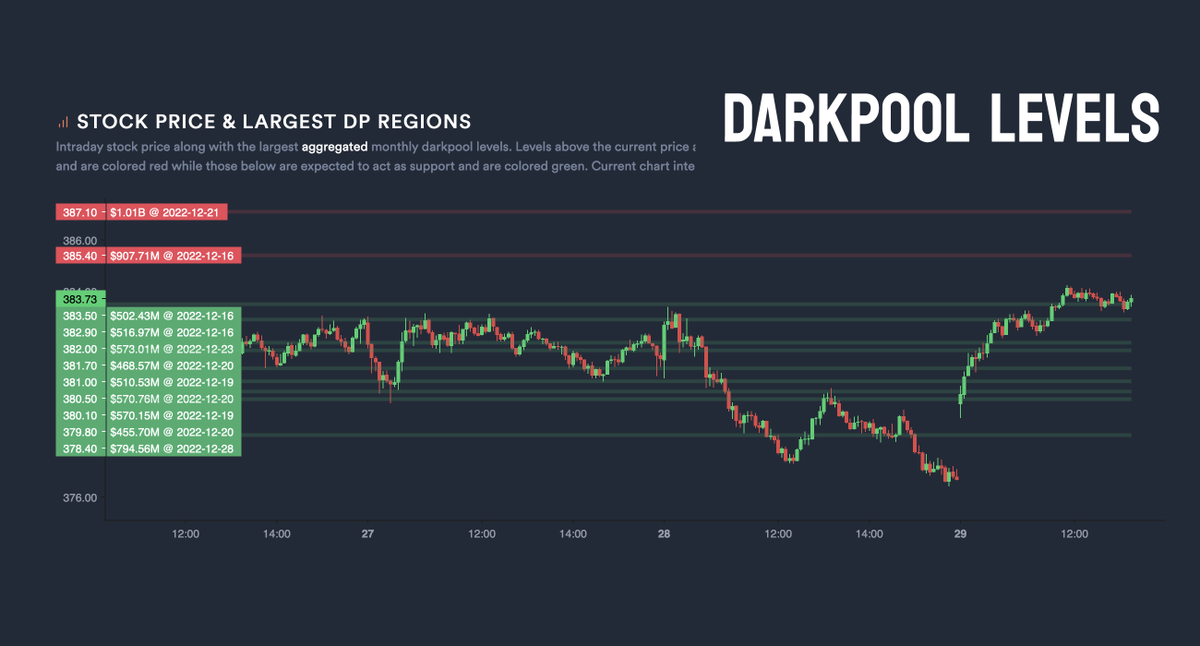
Let's assume we have a big darkpool level at 385, what happens when we reach towards that level from below 385, we could find some resistance.

Why is that? Because the smart money might go into a losing position if they had a short position at 385, and they'll come to defend!
Dec 28, 2022 5 tweets 2 min read
$TSLA drop from 250 all the way to 100 was fully anticipated by flow traders, it's a beauty! Here's a breakdown 🧵

- October start, we started seeing huge amounts of put buying, and call selling, both bearish signs
- Price dropped, but put buyers never stopped, only took profits - As price dropped, there were occasional selling / profit taking from puts, but the total amount of puts bought has remained extremely high ever since October, look at the right side of the chart, green bars are put buying.
Dec 27, 2022 4 tweets 1 min read
$SPY Dark Pools and how I use them. First, each morning I ping the discord bot "Tr-dplevels spy" and apply the larger one's to my chart. Second, watching them each week you'll start to see a pattern. Numbers above/below may grow larger.

CONT: Image If you look at the $380 level earlier last week, it was smaller. As the week went on, it grew. When I am watching price action, I'm looking for Dark pools to help indicate a Support or Resistance level. A case could be made that $380 is now a good sized support.
Dec 26, 2022 5 tweets 2 min read
Let's talk about Santa Rally & look at the data to form opinions $SPY $SPX 🧵

1. Darkpools are neutral / slightly bearish.
2. Massive put flow last week, but could also force dealers to unwind & lead to rally on Friday.
3. Neutral / slightly bullish delta correlations!

Cont. Image Since we're looking at a very short time frame, the most important data point here is the delta correlations which have gotten a bit positive for the first time in the last few weeks.

There's a tail i.e 5% probability of a 5-7% downward move, apart from that, it looks bullish.
Oct 18, 2022 4 tweets 1 min read
Why is flow so important! $SPY 🖐️

I don't use the 7 day to make trades, but this is such a beautiful chart to show what's been happening. Flow traders loaded up on calls yesterday, we got the gap up, and now they're unloading all those calls.

Puts are flat! Why? comment below Image To me, puts flat shows short term flow traders are not sure about any direction right now, which is why they are taking profits, but they are not buying puts or calls anymore, they're going in cash.

The chart above is 7 day only! Wanted to highlight short term flow.
Oct 18, 2022 5 tweets 2 min read
By no means have I ever thought that we're the absolute right platform!

But all these posts on
- record put buying
- highest volume
- only twice in history have we seen this

only mislead retail. To me, the 5 day market net flow is the best gauge of flow sentiment, respectfully! Image I am not talking about the daily flow, more like a slightly longer term perspective as to what flow is really saying.

If someone puts in a billion dollars in a $SPY call, that does not mean we are 1 billion dollars on the bullish side.

There are so many other variables..
Sep 6, 2022 5 tweets 2 min read
New videos out 🎉

1. Ghost Zones, Putting gamma levels to use in a unique way -

2. Gamma Exposure, A Data Driven Guide -

3. Advanced DEX Strategy, Market Crosses - Ghost Zones! 👇

These are zones with minimal presence of market makers, and can allow the price to move freely! Most people want to look at big gamma levels, we thought what happens when there's no gamma, and we found interesting results.
Aug 17, 2022 7 tweets 2 min read
Some thoughts on how dealer positioning is paramount to big moves like the ones in $BBBY 🧵

Any big move in meme stocks for the most part need a dealer positioning that supports it. Let's talk about what could have happened with this recent big move.

It's so interesting. Before the big move started, dealers were already short deltas which means they were buying the underlying shares to hedge positions.

So they're sitting on long positions, good to know. Then we also had negative gamma exposure.

How does GEX impact this?
Aug 15, 2022 4 tweets 1 min read
Many bears still calling for a leg down? Are those baseless claims? Let's look at data to find an answer 🧵

The chart below shows how 30-day price moved for different darkpool flows in the past. When flows are large, $SPY trends to go up most of the time.

However... Anytime in the past we've been in the 10-20 million dollar range, that's when most of the big corrections have occurred.

The yellow circle is where we're at today. And it's very close to that range. If we increase in darkpool volume a bit, we'll go right into the range.
Aug 4, 2022 5 tweets 1 min read
Let's talk about convergence indicator! Wait, what's that 🧵

Convergence = Whether both price and flow are going with each other.

I added it a while back but wanted to spend a few days before talking about it. One way to play MNF is to only make plays when we're in convergence When we are in convergence, that means things are working well, and simply going with the flow is doing good. So we should simply do that as well.

That's when we have the bar above zero, and green or red depending on what the actual flow is.
Aug 2, 2022 5 tweets 2 min read
What if we were to look at DP data at different times, and see where market moved next? 🧵

Well, this chart in Darkpool Market Dashboard shows it, and it's one beautiful chart.

White line is distribution based on where we're at today, others are past important dates. Cont. Image What does this chart shows?

Given the current darkpool levels in the market, there is a higher expectation of a downward move. Most previous times (month to date, year to date, before COVID, after COVID) had better distributions to the right i.e expected move up!
Aug 1, 2022 4 tweets 1 min read
Market net flow, 7 days out filtered 👇

We are starting the week very mixed here as almost all longer term flow is equal puts and calls.

The weekly flow is the only thing that’s bullish which could means smaller plays and quicker moves. Trade accordingly.

$SPY $QQQ If the unfiltered flow turns positive as well, that’s a good sign. But until only short term flow is bullish, do not go in too heavy.

Command to get this chart in discord
tr-netflow MARKET 1 7
Jul 19, 2022 6 tweets 2 min read
Why does market net flow work so well? 🧵

Flow trades force market makers to take the opposite side of the trade, and hedge with the underlying. When we buy lots of calls, MMs have to sell calls, and buy shares to hedge.

That buying pressure can help an upward momentum. Cont. Since market net flow takes into account every single flow transaction, and also tries to identify the direction, it is basically letting us know what market makers will have to do!

That's one aspect of why it works, it provides us some help from MMs in short term.
May 17, 2022 4 tweets 1 min read
WHAT IS MOMENTUM IN MARKET FLOW 👇

Important to understand to know why it fails when it fails.

Momentum = Current Net Flow - Avg Net Flow in Some Historical Period (60 mins on web)

How to use it well? Cont. 1. You should either only use it for quick scalps because when momentum changes, price sometimes make quick very short term moves.

2. It should be a secondary signal to the overall market net flow and market crosses, that might work better for you.
May 4, 2022 4 tweets 1 min read
GOT THE BULLISH CROSS! 🥰 Important levels, 5 minute chart. Would love if we break this upper one. Image
May 4, 2022 4 tweets 1 min read
BACKTEST STAT FOR MARKET NET FLOW 👇

If you played the market crosses based on the MARKET net flow from September onwards, you would have made 6-12% while $SPY is down 10% in the same time.

You would have only made about 100 trades in total in that time! This is a pretty rough number and it varies from 6-12% based on different strategies.

1. Using moving averages
2. Using 1-min VWAP
3. Using slightly advanced methods like AI classifiers to filter down trades

Most gains were made in the last 4 months.
May 3, 2022 4 tweets 1 min read
MARKET CROSS STRATEGY V1 FOR $SPY 😎

1. Skip first 30 mins of day
2. Wait for bullish or bearish market crosses
3. For bullish ones, wait until we break the high of the day, ENTER.
4. For bearish, wait till low of the day break, then ENTER.

You'll see amazing results!

Cont. Profit Taking 👇
Your profit taking is either at the end of day, or if an opposite cross gets formed.

Stoploss 👇
Your stoploss should be slightly below your entry price, or if an opposite cross gets formed, then just get out.
May 1, 2022 4 tweets 2 min read
MARKET NETFLOW TO THE WEBSITE 🥳

Market net flow is now available on the Options Market Dashboard on the website. Enjoy, and put in the work to prepare for your week

Dashboard link: tradytics.com/options-market For those who are new and don't know what Algo or Net flow is, here's a video on the topic -

Market flow is simply a generalization of Net flow for all stocks in the market.
Apr 28, 2022 4 tweets 1 min read
MARKET ALGO $SPY $QQQ 👊

A bit weak flow to start the day, there were a few calls but there are also good amount of puts now. We're mostly at even now - we want to see a direction here.

Net prems are about 0. Let's wait for a clear direction from the flow side. 
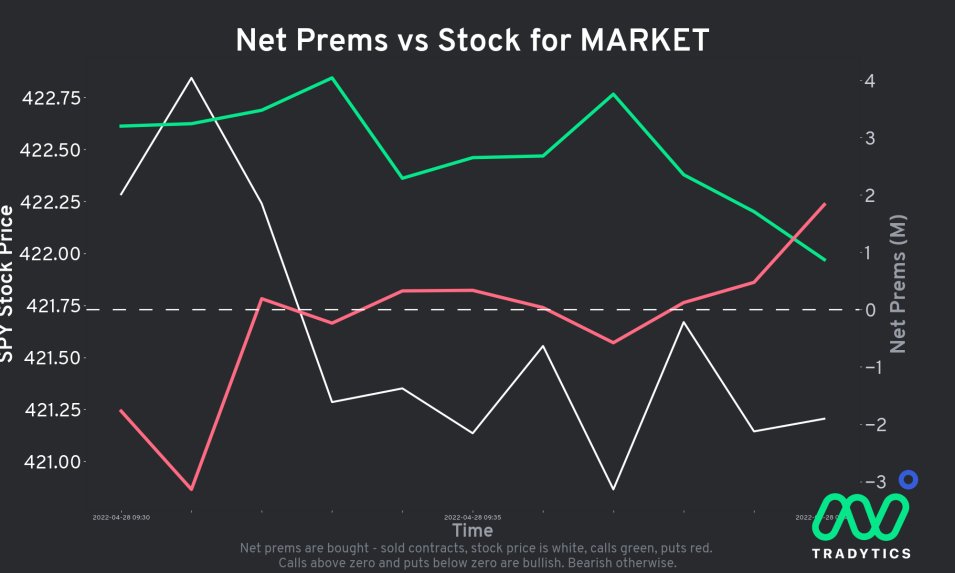
Not the time to get any calls right now. Puts leading.
Apr 27, 2022 6 tweets 2 min read
JUST LAUNCHED MARKET'S ALGO FLOW 🧵

A user had noted that it is important to look at the entire market's flow to gauge $SPY & $QQQ direction, not just their individual flow.

That's a good point, and we now have a command for it.

tr-algoflow MARKET
tr-netflow MARKET

cont. How do we calculate this?

We basically sum up algoflows/netflows for all stocks + indices and chart them against $SPY. There are a few considerations here that we'll test for the next few days. But this is the new default for gauging market direction now.