So happy to see our article forthcoming at AEJ: Applied 🥳 This was the very first paper I ever worked on, quite a journey since we started collecting data in 2017 with @thomas_blncht and @lucas_chancel!
Here are five facts that we uncover about income inequality in 🇪🇺 and 🇺🇸: 👇
1/ Income inequality has risen faster in Eastern Europe than in Western/Northern Europe, but in no European country have top incomes boomed quite as fast as in the US.
2/ This holds when looking not only at European countries, but also at the European continent as a whole. Within-state inequality explains 97% of ineq in the US, while within-country inequality explains 83% of ineq in Europe today.
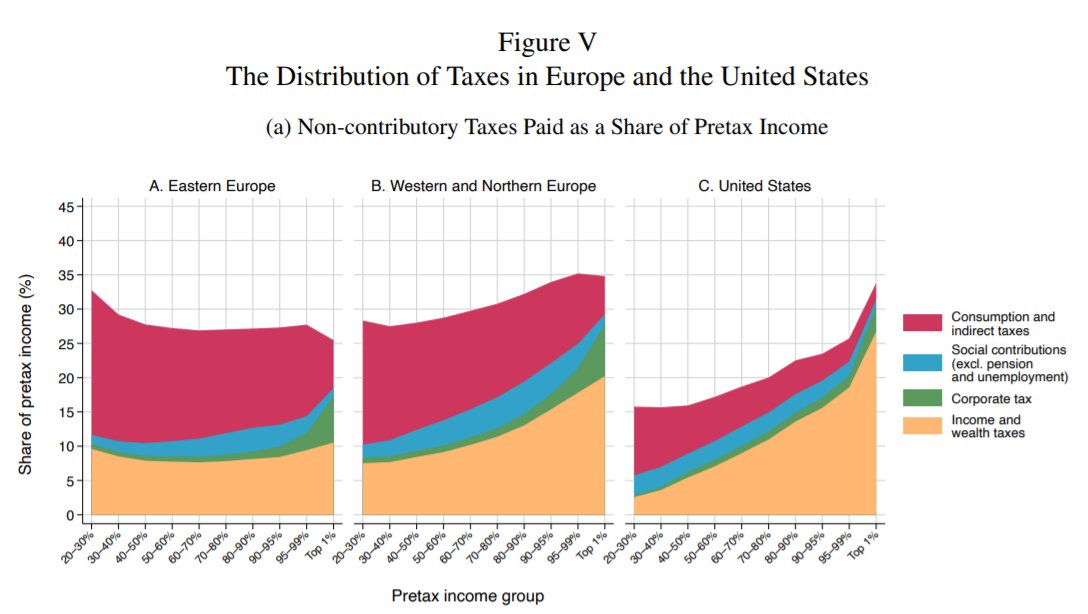
3/ The US tax system is MORE progressive than European countries'.
This is because the personal income tax is about as progressive in the US as in Western Europe (and much more progressive than in Eastern Europe), while indirect taxes are much lower.
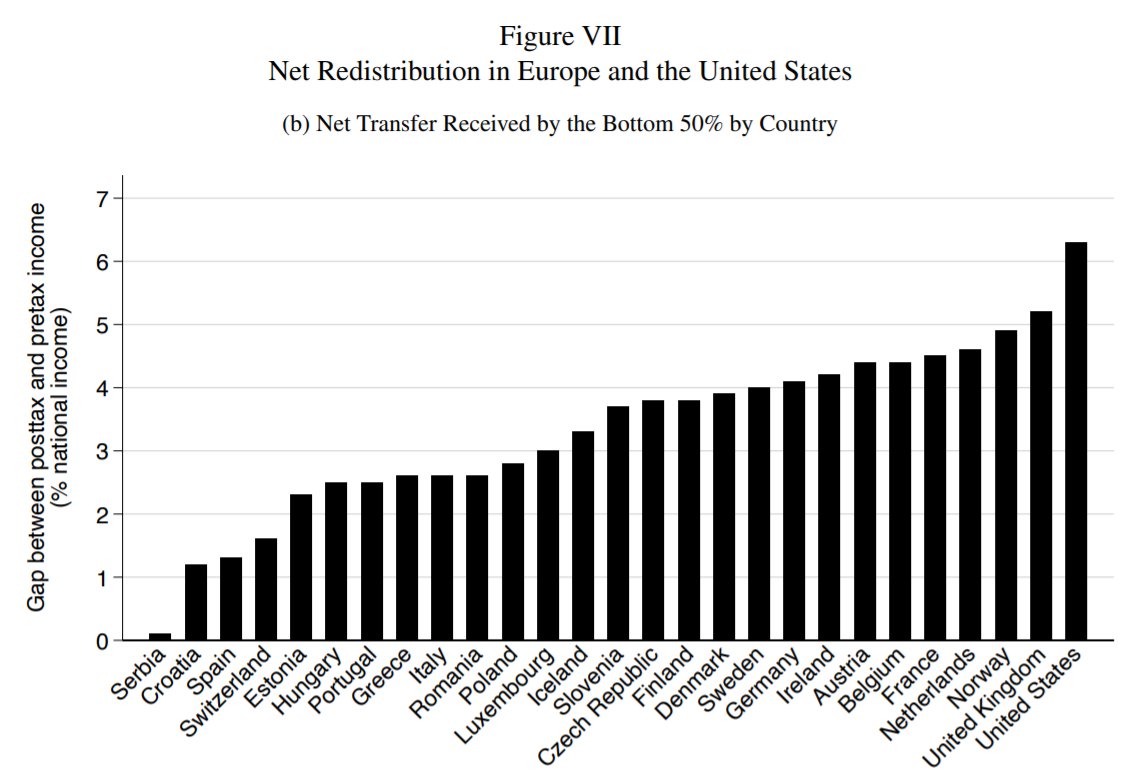
4/ As a result, despite lower transfers, the US tax-and-transfer system is MORE redistributive than that of any European country.
About 6% of the national income is transferred to the bottom 50% in the US, versus 4% in Sweden and 0% in Serbia.
5/ Although the US tax-and-transfer system is more progressive, it is not progressive enough to close the huge inequality gap between the two regions.
Predistribution, not redistribution, explains why Europe is less unequal than the US today, both in pretax and posttax terms.
If you want to know more about the paper and the dynamics of specific countries, the latest working paper version of the article can be found here! wid.world/document/why-i…
You can also visit our (slightly long) appendix, where we provide additional figures and detailed results on inequality and redistribution in the 38 European countries covered by the paper: wid.world/document/techn…
• • •
Missing some Tweet in this thread? You can try to
force a refresh
🔗In this paper we construct a new database on human capital investment worldwide since 1800.
1⃣ World inequalities in HK investment are abysmal. If anything, they have increased.
2⃣ Substantial efforts at equalizing investment could play a key role in productivity convergence.
Education spending per child in Sub-Saharan Africa was about 4% of European/North American levels in 1950. It is about 3% today.
South and South-East Asia have started to catch up but still invest less than 10% of European/North American levels.
As a % of GDP, pooling private and public resources, the U.S. ends up investing significantly more in education than Europe!
Other regions of the world continue to lag behind despite some progress in most regions.
👋New paper!
How do hours worked vary across countries, historically, and why?
We construct a new microdatabase covering 160 countries, including long time series in 86 countries, to revisit these questions. 👇
Our database builds from the incredible efforts made by the ILO and World Bank at compiling surveys from around the world. Combining their harmonized data with other sources, we build a new database covering hours worked in 2,490 surveys fielded in 160 countries.
Result 1: globally, employed adults work 43 hours per week. 58% of them are employed.
👉hours per adult = 25 per week.
Hours worked are very strongly bell shaped with age.
Women supply 35% of global hours worked.
Incredibly happy to see my paper forthcoming in @QJEHarvard! I quantify how much of worldwide growth and poverty reduction can be accounted for by education over 1980-2019. A quick summary 1/9 👇
There have been enormous improvements in educational attainment since 1980. For instance, the share of the world's adults with at least some secondary education rose from about 20% to 55%. 2/9
To estimate the effects of educational progress on worldwide growth and poverty reduction, I assemble a new microdatabase covering education and earnings in 154 countries. 3/9
Global poverty is commonly measured by counting the number of people whose consumption falls below a given threshold.
This approach overlooks an enormous component of people’s economic well-being: public goods. 🧵
Existing measures of global poverty (e.g., World Bank) are based on household consumption = market value of all goods and services purchased by households.
These measures exclude public goods, since these goods are not bought on a market.
This has two implications.
First, it biases our knowledge of national differences in poverty.
5% of Indians are poor because of private health expenditure, compared to 0% of South Africans, largely thanks to public healthcare!
Yet South African public healthcare is valued in existing poverty stats as… 0.
How does redistribution vary over the course of development?
Has there been a convergence in tax-and-transfer systems?
We Matt Fisher-Post, we paint the first global picture of government redistribution since 1980.
5 stylized facts: 🧵
@voxeu @BaldwinRE cepr.org/voxeu/columns/…
1/ Government redistribution always reduces inequality, but with large variations.
2/ Transfers are the dominant driver of redistribution: in most countries in the world, tax systems are flat or regressive.
Excited to present my job market paper!
Exploiting a unique microdatabase, I estimate that education accounts for:
1⃣ 50% of global economic growth since 1980
2⃣ 70% of growth for the world’s poorest 20%
3⃣ 50% of global gender inequality reduction
🔗 amory-gethin.fr/files/pdf/Geth…
The starting point is a new microdatabase representative of 95% of the world’s population, which I assemble by harmonizing surveys fielded in 150 countries around 2019. It provides comprehensive information on education, individual incomes, and other sociodemographics.
Starting from this database, I estimate what the world distribution of income would look like if education had not improved.
I develop tools for “distributional growth accounting,” incorporating imperfect substitution à la Goldin & Katz into the canonical growth decomposition.