
Swing Trading Strategy
That can help you generate 3 to 5% Monthly
A thread 📕
Using RS , MACD , 21 EMA and Price Action
All Concepts Explained !
RETWEET AND SHARE !
#StockMarket
@kuttrapali26 @ArjunB9591
1/n
That can help you generate 3 to 5% Monthly
A thread 📕
Using RS , MACD , 21 EMA and Price Action
All Concepts Explained !
RETWEET AND SHARE !
#StockMarket
@kuttrapali26 @ArjunB9591
1/n
UNDERSTANDING MACD
Moving average convergence divergence (MACD) is a trend-following momentum indicator that shows the relationship between two moving averages of stock.
It is calculated by subtracting the 26-period exponential moving average (EMA) from the 12-period EMA.
2/n
Moving average convergence divergence (MACD) is a trend-following momentum indicator that shows the relationship between two moving averages of stock.
It is calculated by subtracting the 26-period exponential moving average (EMA) from the 12-period EMA.
2/n

The result of that calculation is the MACD line. A nine-day EMA of the MACD called the "signal line," is then plotted on top of the MACD line, which can function as a trigger for buy and sell signals.
3/n
3/n

Traders may buy the security when the MACD crosses above its signal line and sell—or short—the security when the MACD crosses below the signal line.
4/n
4/n


UNDERSTANDING RELATIVE STREGTH
1.Relative strength is a strategy used in momentum investing and in identifying value stocks.
2. It focuses on investing in stocks or other investments that have performed well relative to the market as a whole or to a relevant benchmark.
5/N
1.Relative strength is a strategy used in momentum investing and in identifying value stocks.
2. It focuses on investing in stocks or other investments that have performed well relative to the market as a whole or to a relevant benchmark.
5/N
For example, a relative strength investor might select technology companies that have outperformed the Nifty50, or stocks that are outperforming the Nifty 500
HOW TO APPLY IN TRADINGVIEW?
Type
“Relative Strength”
Choose any
I USE By bharattrader
By traderlion
By Modhelius
6/n
HOW TO APPLY IN TRADINGVIEW?
Type
“Relative Strength”
Choose any
I USE By bharattrader
By traderlion
By Modhelius
6/n


WHY RS?
Helps to filter out stocks in good momentum and that are giving better returns than nifty
These stocks tend to outperform the market for a long term
These are potentially superstocks
65 period signifies 3 months of trading
In 3 months we have around 65 trading days
7/n
Helps to filter out stocks in good momentum and that are giving better returns than nifty
These stocks tend to outperform the market for a long term
These are potentially superstocks
65 period signifies 3 months of trading
In 3 months we have around 65 trading days
7/n


UNDERSTANDING 21 EMA
1. The 21 ema will help us to identify the trend of stock
2. A stock above 21 ema will never be shorted and a stock below 21 ema will never be bought
A trending stock will always be above 21 ema and will generally pullback to 21 ema to give multiple entries
1. The 21 ema will help us to identify the trend of stock
2. A stock above 21 ema will never be shorted and a stock below 21 ema will never be bought
A trending stock will always be above 21 ema and will generally pullback to 21 ema to give multiple entries

Combining all the tools
Buy Signal Rules
Stock above 21 ema
Macd buy crossover
Rs line increasing and in positive
Volume up on updays and down on downdays
Target 10 to 15%or can be trailed using 21 ema
Stop loss max 7% in any case or nearest swing whichever is less
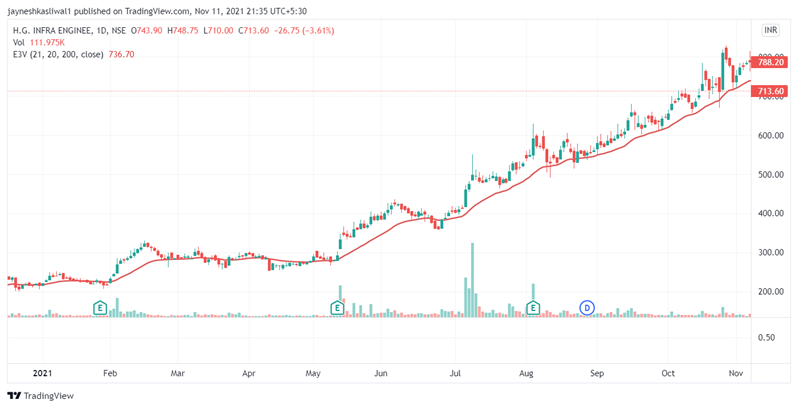
LONG:
9/n
Buy Signal Rules
Stock above 21 ema
Macd buy crossover
Rs line increasing and in positive
Volume up on updays and down on downdays
Target 10 to 15%or can be trailed using 21 ema
Stop loss max 7% in any case or nearest swing whichever is less
LONG:
9/n

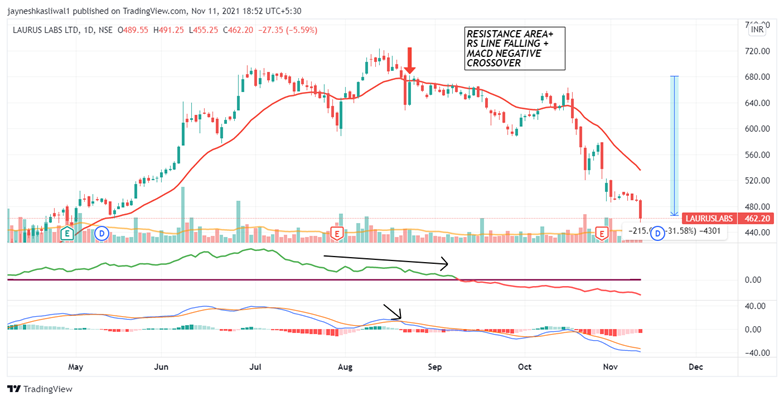
Sell Signal Rules
Stock Below 21 ema
Macd Sell crossover
Rs line decreasing
If Rs line is in negative that’s too good
Price near resistance or bearish patterns like double tops etx
Target 10 to 15%or can be trailed using 21 ema
SHORT SIGNAL:IGL
10/n
Stock Below 21 ema
Macd Sell crossover
Rs line decreasing
If Rs line is in negative that’s too good
Price near resistance or bearish patterns like double tops etx
Target 10 to 15%or can be trailed using 21 ema
SHORT SIGNAL:IGL
10/n

Stop loss max 7% in any case or nearest swing whichever is less
Ideal stop loss 5%
Position size 5%
11/n
Ideal stop loss 5%
Position size 5%
11/n
How you can get out at tops
During distribution stock generally goes sideways
RS keeps on decreasing and soon MACD gives sell signal
Always wait for close below 21 ema before exiting a stock
During sideways zone at top of trend instituations will generally book profits
12/n
During distribution stock generally goes sideways
RS keeps on decreasing and soon MACD gives sell signal
Always wait for close below 21 ema before exiting a stock
During sideways zone at top of trend instituations will generally book profits
12/n

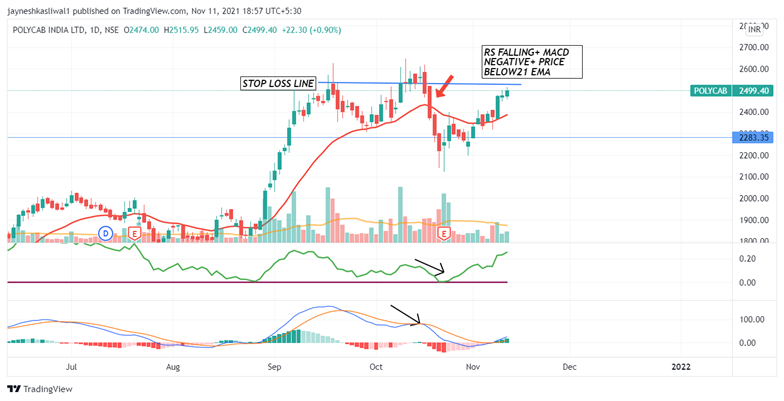
#POLYCABS EXAMPLE
Whipsaws
1. As we are using lagging indicators we may get multiple buy sell signals in short span of time
Even if we get Multiple Sl hit
2.The sl during sideways will be generally small as we are keeping 21 ema as stop loss
14/n
Whipsaws
1. As we are using lagging indicators we may get multiple buy sell signals in short span of time
Even if we get Multiple Sl hit
2.The sl during sideways will be generally small as we are keeping 21 ema as stop loss
14/n

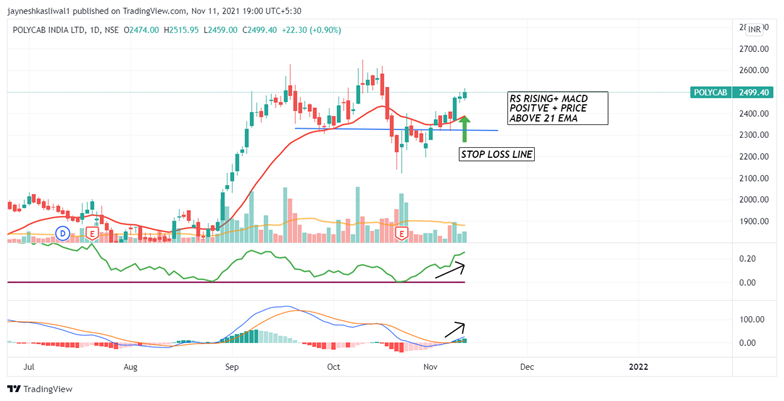
3. Sl % should be in 4 to 5 % range
4. You may enter late and exit late if you follow exactly the signals as indicators are lagging
5. Its better to be a small part of the larger trend and getout
15/n
4. You may enter late and exit late if you follow exactly the signals as indicators are lagging
5. Its better to be a small part of the larger trend and getout
15/n
When not to take trade
Even if you get a buy signal sometimes its good to avoid trades to avoid big draw down
One such instance is when the price has deviated more than 7% from the 21 ema when the signal is given
#MINDAIND
16/n
Even if you get a buy signal sometimes its good to avoid trades to avoid big draw down
One such instance is when the price has deviated more than 7% from the 21 ema when the signal is given
#MINDAIND
16/n

High Reward trades
1 stock will compensate for all your minor losses
This is a trend following system hence if you catch even 1 stock out of 10 that could give 30 40% in short time this could take your returns to multifold
As we are having a max loss limit of 7%
17/n
1 stock will compensate for all your minor losses
This is a trend following system hence if you catch even 1 stock out of 10 that could give 30 40% in short time this could take your returns to multifold
As we are having a max loss limit of 7%
17/n


Please Note :
This is a momentum based trend following strategy .
The returns may vary depending upon the trend of overall market .
All Strategy have Drawdown period.
Please Backtest and try it on your own with small amount to Check the Success ratio .
This is a momentum based trend following strategy .
The returns may vary depending upon the trend of overall market .
All Strategy have Drawdown period.
Please Backtest and try it on your own with small amount to Check the Success ratio .
t.me/Techno_charts
Follow Telegram for More such Content !
Follow Telegram for More such Content !
• • •
Missing some Tweet in this thread? You can try to
force a refresh


