JayneshKasliwal Profile picture
Nov 22, 2021 6 tweets 5 min read Read on X
A thread on how to draw trendlines!

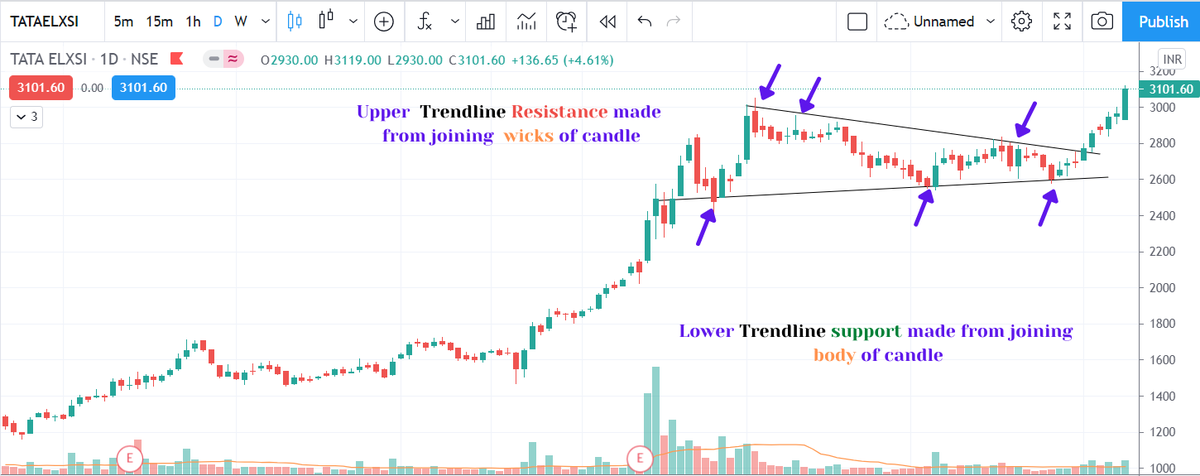
Confused between connecting wicks or bodies while drawing a trendline ?
Our main aim to draw trendline is to get maximum points of price on a line .
It can be through wicks tails or body and there is no fixed rule !

RETWEET SHARE🔄 !
1/n ImageImageImageImage
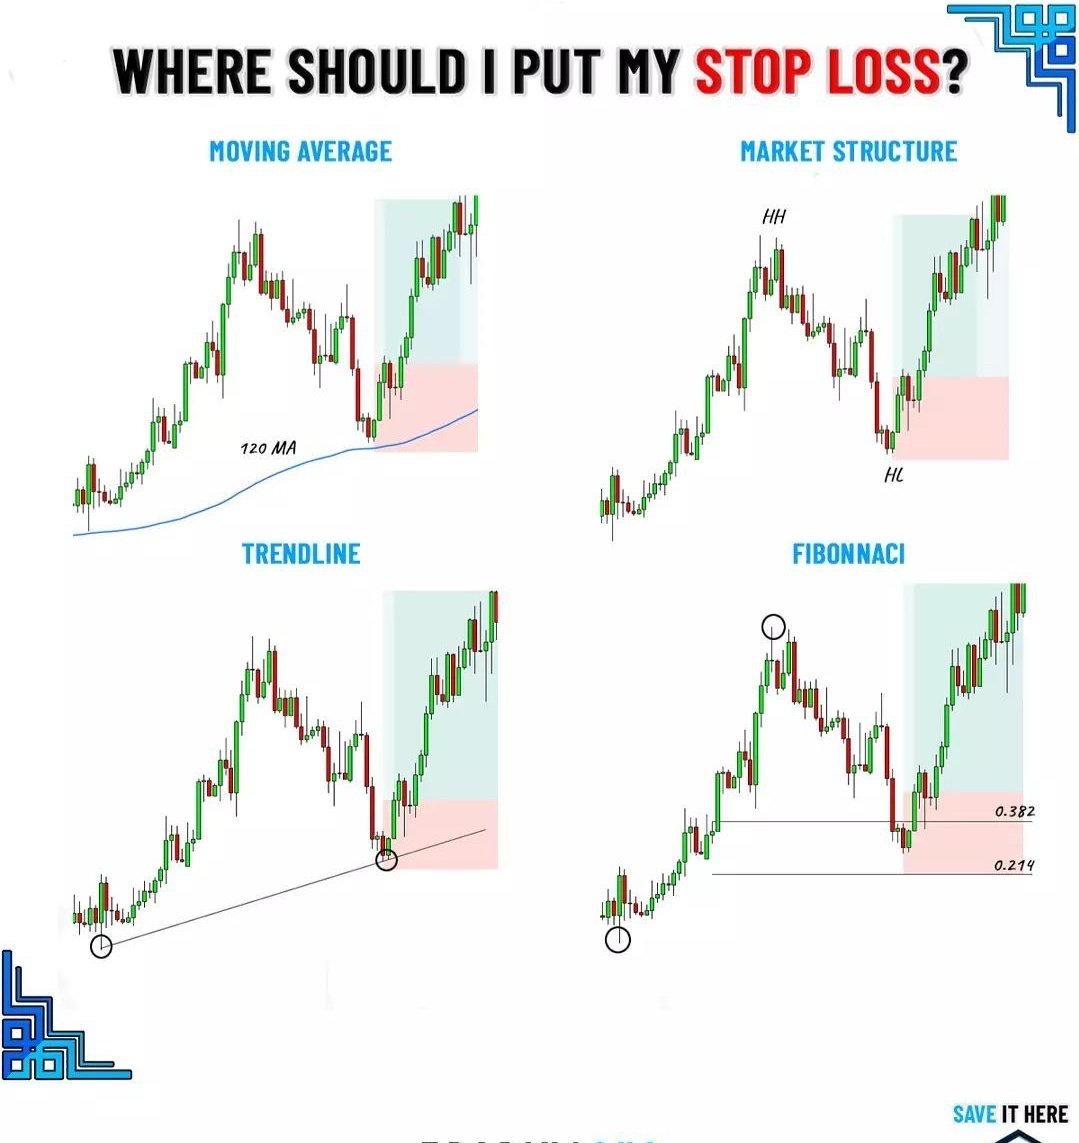
Trendline as Trailing Stop Loss.
1. Trending stock Tends to pullback near Moving averages and trendlines .
2. This could be areas of fresh buying or you can shift your Stop loss to upside
3. As soon as trendline is broken then you can sell a stock and take reverse position

2/n ImageImageImage
Trendline as Trendreversal
1. You can Buy breakouts of trendline in a downtrend
once the trend is changed with emergence of HH HL structure
2. You can initiate long postion with Stop at previous swing low
3. Sometimes you may find retest on trendline also

3/n ImageImageImage
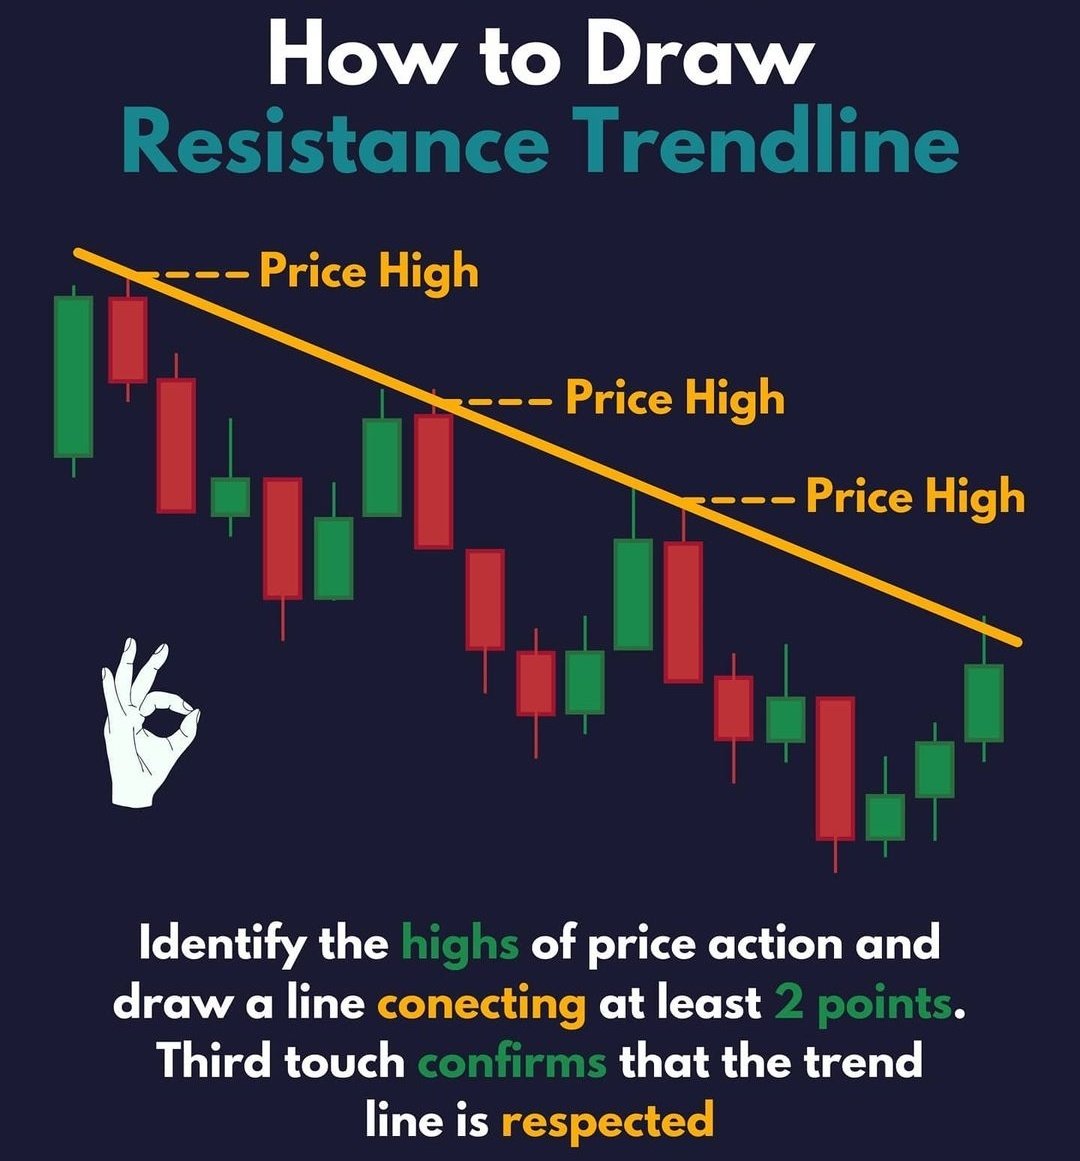
Trendline Breakout in uptrend

Buying on breakouts of trendline
Look for Volume Confirmation

4/n ImageImageImage
Trendline will act as Support and Resistance
Simple Strategy of Buy Low Sell High works best combined with other buying rules

5/n

@kuttrapali26 @AmitabhJha3 @rohanshah619 ImageImageImageImage
@rattibha compile

• • •

Missing some Tweet in this thread? You can try to force a refresh
 

Keep Current with JayneshKasliwal

JayneshKasliwal Profile picture

Stay in touch and get notified when new unrolls are available from this author!

Read all threads

This Thread may be Removed Anytime!

PDF

Twitter may remove this content at anytime! Save it as PDF for later use!

Try unrolling a thread yourself!

how to unroll video
  1. Follow @ThreadReaderApp to mention us!

  2. From a Twitter thread mention us with a keyword "unroll"
@threadreaderapp unroll

Practice here first or read more on our help page!

More from @JayneshKasliwal

Oct 11
How to use the Best Chartink Dashboard
Easy and FREE
A Thread 🧵 Image
Minervini Trend Template : Filters out sideways or weak stocks.
Focuses on names that already have institutional buying interest.
Helps avoid “cheap” stocks that are actually weak trends.

IPO Scan : Lists out Stocks that have got listed recently
These two scans are used for spotting momentum stocks:Image
Top Gainers for the Day → Shows stocks with the highest price percentage increase today.
Good for finding intraday momentum leaders.

Top Relative Volume Gainers → Shows stocks with trading volume much higher than their 50-day average (relative volume spike).
Good for spotting unusual activity that might signal news, breakouts, or big moves.Image
Read 9 tweets
Oct 8
How to Invest in the US Market From India
In this thread we will cover taxes , brokerage and other expenses
A Thread🧵
How to get started:

Download the Vested Finance app or visit
[ Get 450Rs on first deposit ]
Sign up with your PAN, Aadhaar & bank details
Complete KYC (takes 15 mins )
Once approved, you get a US brokerage accountbit.ly/VestedFinanceX…
💰 Funding your account (RBI LRS route)

Add your Indian bank account

Transfer up to $250,000/year under the Liberalised Remittance Scheme (LRS)

No Fixed Fee
Funds show up in 1 Business day Image
Image
Read 9 tweets
Oct 4
How to invest in US Stock Market from India

In this thread we will cover taxes , brokerage and reasons to invest in US markets 🧵
Why to Invest in US market :
Reason #1: Global Giants
9 out of the world’s top 10 companies by market cap are US-based — Apple, Microsoft, Nvidia, Amazon, Google.
If you use their products daily, why not own their stocks too? Image
Reason #2: Rupee Depreciation
Over the last 15 years, INR has consistently fallen against USD.
That means Indian investors earn an extra 2–3% return on average vs Americans in US markets. Image
Read 11 tweets
Sep 6
Most traders ignore one of the most powerful indicators: Relative Strength (RS).

It helps you spot outperforming stocks vs. benchmarks like Nifty, Bank Nifty, Midcap, etc.
Here’s a full breakdown 🧵 Image
📌 What is Relative Strength?
It compares a stock’s performance against an index.
● If Stock A gives +30% in 3 months
● Nifty gives +10% in same period
➡️ Stock A is an outperformer.

Even if both fall, the one that falls less is still stronger Image
Why it matters?
● Helps you pick leaders, not laggards.

● Outperformers tend to stay strong longer.

● Perfect for swing & positional trading.
Read 12 tweets
Sep 4
Want to transfer your shares from one broker to another?
It’s easier than you think in 2025

Here’s a simple step-by-step guide using CDSL Easiest 🧵👇
Before starting, keep these 4 things ready:

✅PAN Card
✅Registered Mobile Number (linked with Aadhar & broker)
✅BOID (Demat ID) of both brokers
✅Registered Email ID
Step 1️⃣: Go to CDSL Easiest and register your account.
👉 You’ll need your DP ID + Client ID (available in your broker profile). Image
Image
Read 12 tweets
Aug 20
Traders have made Lakhs using this Famous Swing Trading Strategy
A thread
Retweet for PDF
It is characterized by a period of price volatility followed by a contraction phase, leading to a breakout in the stock's price. Here's a breakdown of the VCP pattern: Image
Image
Breakout Rules : Buy Stocks on Break , not after breakout Use Alert Systems or place GTT orders near Breakout area If you miss the breakout better to stay away from stock as RR goes out of favour Image
Image
Read 12 tweets

Did Thread Reader help you today?

Support us! We are indie developers!


This site is made by just two indie developers on a laptop doing marketing, support and development! Read more about the story.

Become a Premium Member ($3/month or $30/year) and get exclusive features!

Become Premium

Don't want to be a Premium member but still want to support us?

Make a small donation by buying us coffee ($5) or help with server cost ($10)

Donate via Paypal

Or Donate anonymously using crypto!

Ethereum

0xfe58350B80634f60Fa6Dc149a72b4DFbc17D341E copy

Bitcoin

3ATGMxNzCUFzxpMCHL5sWSt4DVtS8UqXpi copy

Thank you for your support!

Follow Us!

:(