Robby Profile picture
Nov 23, 2021 8 tweets 3 min read Read on X
S&P500, $SPY short-term (10-day) Sector Correlations are ultra low closing at .06. In 2021 this condition has preceded sell-offs. Image
Minor-sell offs that is. Black candles highlight days when the short-term #correlation was between 0 and .1. Image
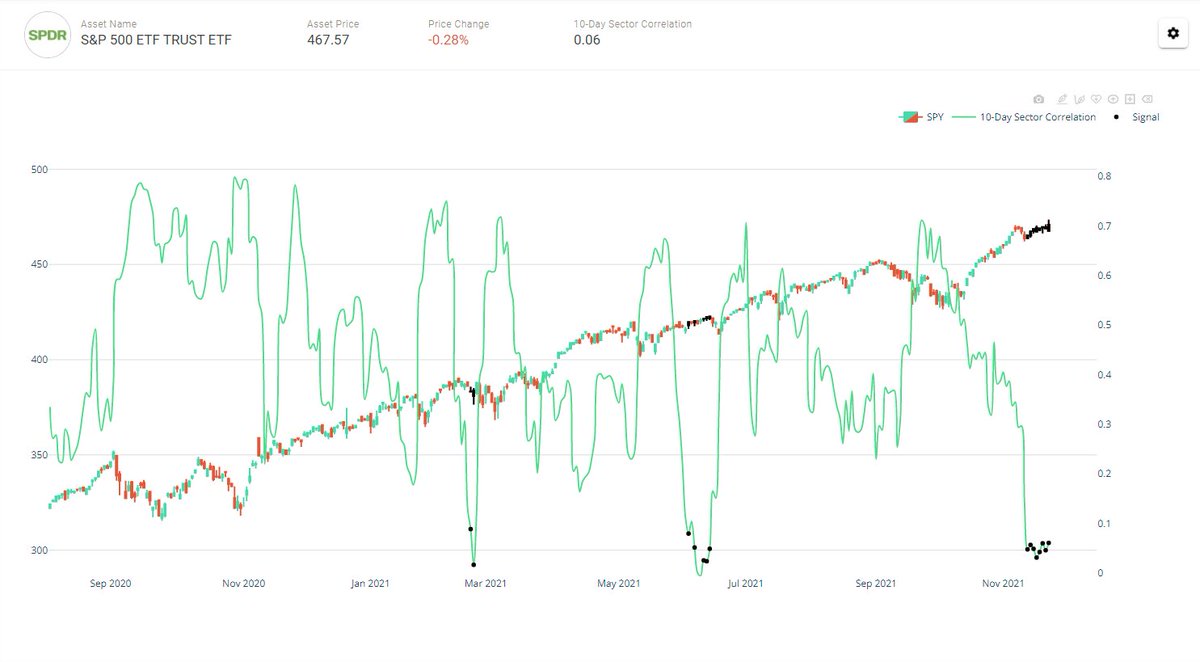
There have been two persistent periods of low-correlation amongst S&P500 sectors those were 2000/2001 and 2017 -- in 2000/2001 it was unfavorable for the index and in 2017 favorable...
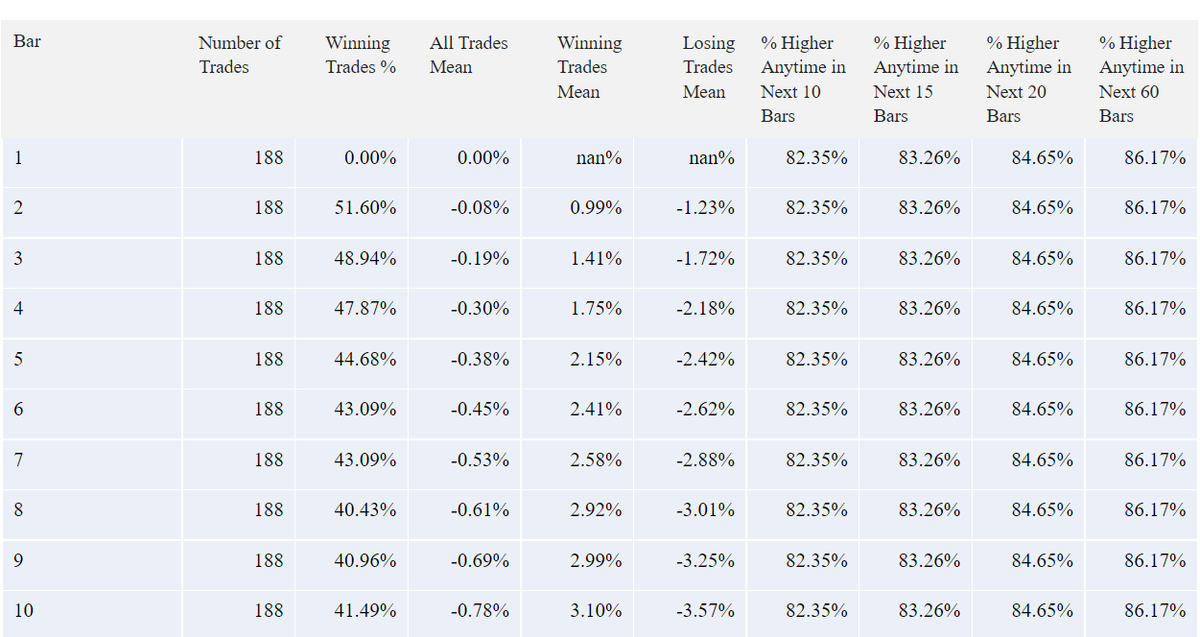
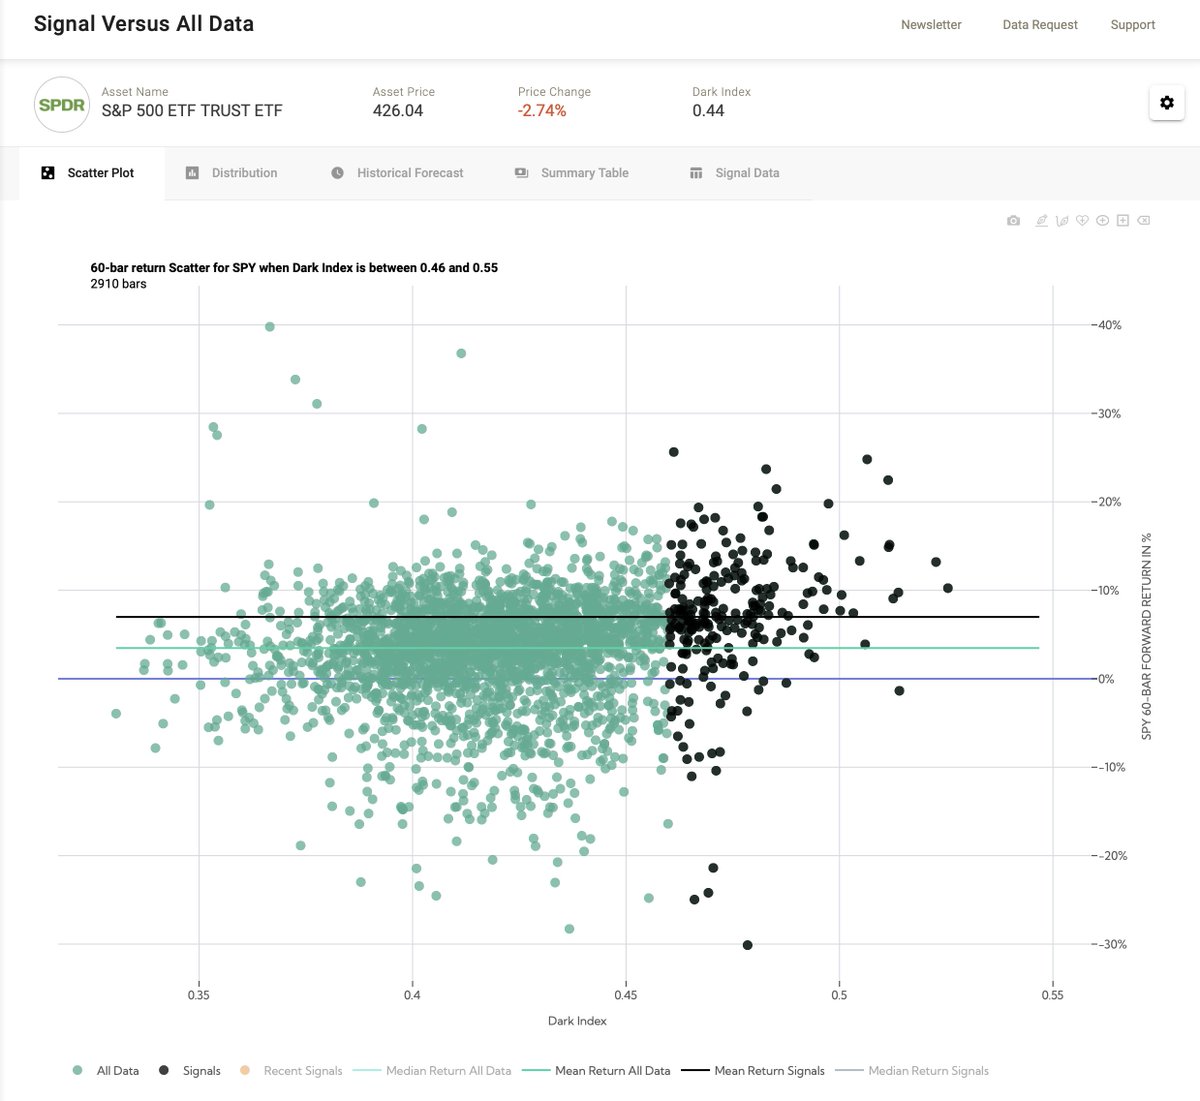
Across all data, the mean return has been negative for mean returns of -1.65%. ImageImage
The evidence that suggests it might be foreshadowing short-term turbulence. $VIX has remain elevated trading 10 pts above realized volatility (black dots) despite the index taking a nap -- and yet it has not materially spiked.

Black dots highlighted a spread of 10pts or higher Image
It has been high both before the minor sell offs of 2021, and at the bottoms.

The blue line shows the 1 week rate of change of the spread, it's not really gone anywhere, closing at 2 points as of Friday the 19th.
Likewise you can see that that by applying a 50 day percentage rank to that spread (90pct to 100pct filtered in black dots), it has been high at both tops and bottoms. Image
And the periodic reminder until I get ATM vol.
Thanks and I hope you found this thread useful. If you did please give it a like and retweet.

All this data can be tracked and backtested on. tradewell.app

• • •

Missing some Tweet in this thread? You can try to force a refresh
 

Keep Current with Robby

Robby Profile picture

Stay in touch and get notified when new unrolls are available from this author!

Read all threads

This Thread may be Removed Anytime!

PDF

Twitter may remove this content at anytime! Save it as PDF for later use!

Try unrolling a thread yourself!

how to unroll video
  1. Follow @ThreadReaderApp to mention us!

  2. From a Twitter thread mention us with a keyword "unroll"
@threadreaderapp unroll

Practice here first or read more on our help page!

More from @HalfersPower

Jul 10, 2022
So far in the 2022 bear market, in each overlapping 10d period the $SPY has ended higher on day 10 32% of the time (mean return -.8%). Yet... in each 10d period the $SPY has closed higher at least once 79% of the time.

A look at historically adverse market regimes below 🔽
In 2001, each overlapping 10-day period saw the $SPY end higher on day 10 ~41.5% of the time with a mean return of -.78%. During each 10-day period it closed higher at least once 82.35% of the time.
In 2002, each overlapping 10-day period saw the $SPY end higher on day 10 ~29% of the time with a mean return of -1.4%. During each 10-day period it closed higher at least once 76.45% of the time.
Read 9 tweets
Apr 27, 2022
In backwardation via $VIX: $VIX3M next month RVOL is highest amongst the deciles (d10 >1) ~43% subsequent realized volatility.
In our historical dataset.. since about later 2007, backwardation has had stronger relative mean returns, especially about 60 days out, but that relationship is not that strong...
But a good starting point is just eyeballing a chart... It's not difficult to eyeball a few times the market got crushed in backwardation, so at least it is difficult to ignore it as a big risk.
Read 6 tweets
Apr 24, 2022
The @squeezemetrics $DIX data a summary of the last ~2 years , what has changed and what has remained the same with regards to $SPY price movements. (1/10) ⬇️
If you aren't familiar with $DIX from ~11'-20', a high print( >.45+) subsequently had strong 60-day mean relative returns on $SPY. The chart below shows the $DIX indicator broken up into deciles. The strongest relative mean returns occurred in the 10th dec. at ~3.5%. (2/10)
This can be see on a scatter-plot as well. The black dots showing a $DIX of >.46 and the difference between the means (black dots mean vs. green dots) ~3.5%. So... what has recently changed? (3/10)
Read 13 tweets
Jan 2, 2022
A couple market observations... short-term S&P500 correlations at .67 or 89th percentile of the past 100 days despite $SPY trading back to ATHs.
Conversely volatility term structure for individual stocks in the S&P500 is mostly in deep contango as measured by the ratio of 30/60 day IV (more blue = more likely in contango and vice-versa)
And implied volatility ($VIX) is priced under high frequency measures of realized volatility (negative) -- only happening one other time in 2021 in March and often going negative before periods of elevated realized volatility.
Read 4 tweets
Dec 6, 2021
Last week the big news was the $VIX term structure backwardating. The chart below looks under the hood at the $SPY component term structure as calculated as ATMIV30/ATMIV60, and is then ranked on a rolling 50 day basis. As of Friday the average rank was just 68 percentile. ⬇️
The Y axis is composed of each S&P500 component. The darker the red, the more likely term structured is backwardated for that component, and the darker the blue, more likely in deep contango. Zooming in to recent data looks like this.
The options market for individual $SPY names on average does not appear to be panicking all that much (yet anyways). Moving on...
Read 8 tweets
Nov 28, 2021
On Friday the SPY had a fire lit underneath it, it was the most illiquid day in a very long time. 332 of the 504 the S&P500 components printed 200 day Illiquidity Ranks above 90%. So what does it mean.
The chart above shows each component of the S&P500 ranked by it's liquidity score and then sorted from top to bottom each and every day. What is transactional liquidity in the markets and how do we measure it? Pop open the image below
So if liquidity is good, then illiquidity is bad. The most recent example of a persistently illiquid period is March 2020. March 2020 saw persistent illiquidity with many stocks trading the entire month near the 100th percentile.
Read 11 tweets

Did Thread Reader help you today?

Support us! We are indie developers!


This site is made by just two indie developers on a laptop doing marketing, support and development! Read more about the story.

Become a Premium Member ($3/month or $30/year) and get exclusive features!

Become Premium

Don't want to be a Premium member but still want to support us?

Make a small donation by buying us coffee ($5) or help with server cost ($10)

Donate via Paypal

Or Donate anonymously using crypto!

Ethereum

0xfe58350B80634f60Fa6Dc149a72b4DFbc17D341E copy

Bitcoin

3ATGMxNzCUFzxpMCHL5sWSt4DVtS8UqXpi copy

Thank you for your support!

Follow Us!

:(