
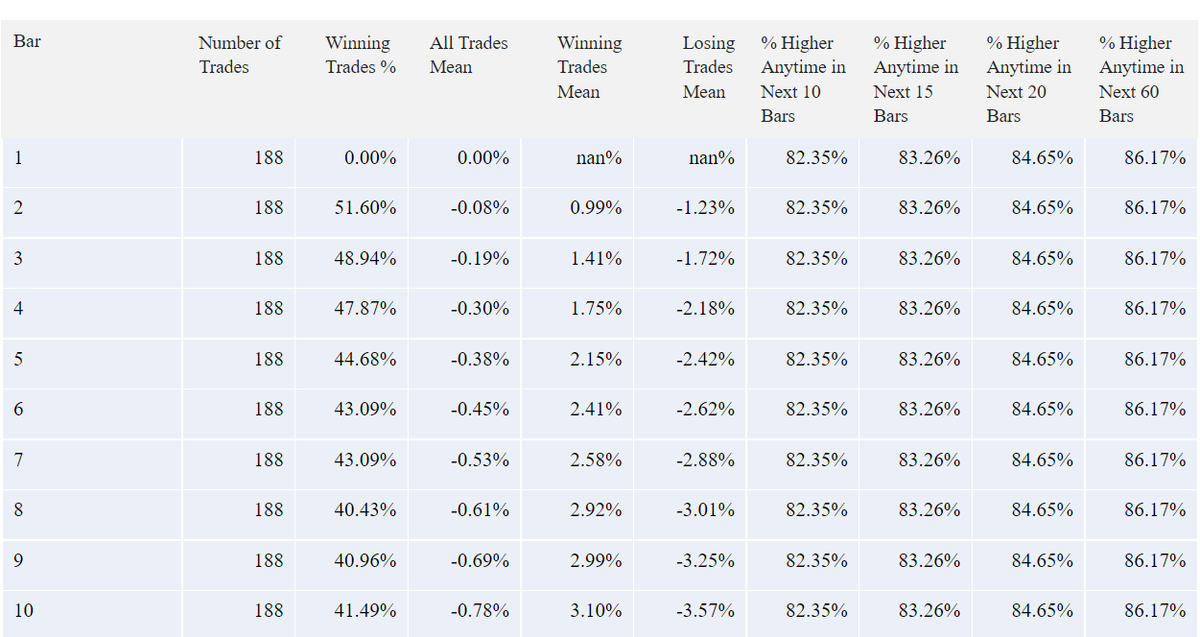
 In 2001, each overlapping 10-day period saw the $SPY end higher on day 10 ~41.5% of the time with a mean return of -.78%. During each 10-day period it closed higher at least once 82.35% of the time.
 In our historical dataset.. since about later 2007, backwardation has had stronger relative mean returns, especially about 60 days out, but that relationship is not that strong...

 Conversely volatility term structure for individual stocks in the S&P500 is mostly in deep contango as measured by the ratio of 30/60 day IV (more blue = more likely in contango and vice-versa)
 The Y axis is composed of each S&P500 component. The darker the red, the more likely term structured is backwardated for that component, and the darker the blue, more likely in deep contango. Zooming in to recent data looks like this.
 The chart above shows each component of the S&P500 ranked by it's liquidity score and then sorted from top to bottom each and every day. What is transactional liquidity in the markets and how do we measure it? Pop open the image below
 Minor-sell offs that is. Black candles highlight days when the short-term #correlation was between 0 and .1.
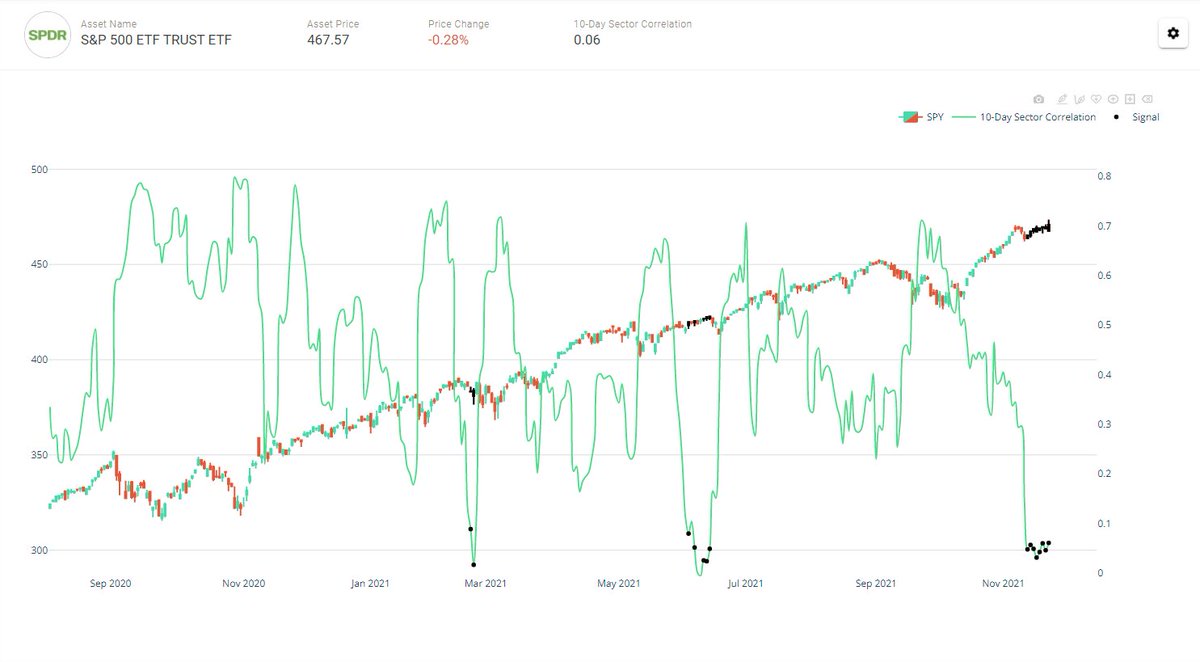

 *Sorry if $VIX % Returns make you mad.

