
1/ Yesterday we had a poll on mortality vs. vaxx rate for the young (15y-29y).
Result (data): no obvious correlation. Not even for the 20-24 year old males, the group with the known (mRNA) myocarditis risk. See e.g. the map.
Today: The elderly (65+). But first a poll 😀
Result (data): no obvious correlation. Not even for the 20-24 year old males, the group with the known (mRNA) myocarditis risk. See e.g. the map.
Today: The elderly (65+). But first a poll 😀
https://twitter.com/orwell2022/status/1463103459968921601

2/ So for the above 65 years olds (where vaxxing is claimed being the most urgent thing apparently), what are your expectations?
Results are ready, but let's give you some time to reflect😀
@jens_140081 @mr_Smith_Econ @OS51388957 @connolly_s @SHomburg @USMortality
Results are ready, but let's give you some time to reflect😀
@jens_140081 @mr_Smith_Econ @OS51388957 @connolly_s @SHomburg @USMortality
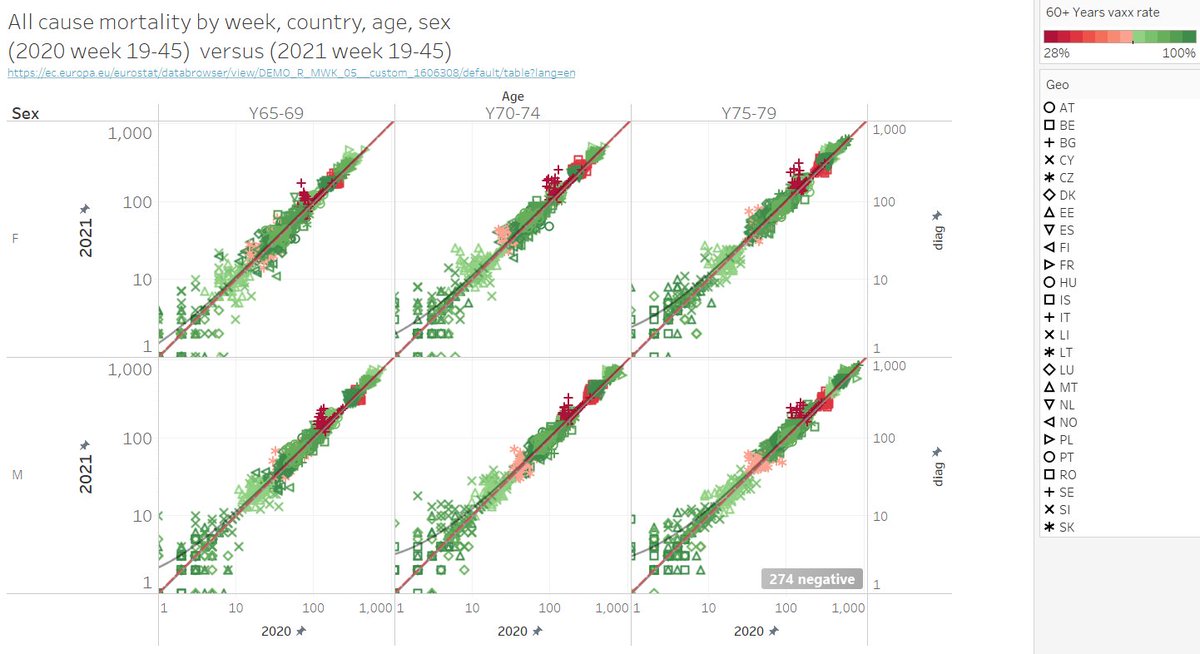
3/ Like yesterday:
first the EC all cause mortality raw data 2020 vs. 2021 (no aggregation: each point is one week).
age: (left) 65-69, (mid) 70-74, (right) 75-79
males (bottom), females (top)
colour by vaxx rate 65+, symbol by country
Pretty diagonal. No💉 correlation. 🧐
first the EC all cause mortality raw data 2020 vs. 2021 (no aggregation: each point is one week).
age: (left) 65-69, (mid) 70-74, (right) 75-79
males (bottom), females (top)
colour by vaxx rate 65+, symbol by country
Pretty diagonal. No💉 correlation. 🧐

4/ No we aggregate this into sum of week 19 to 45. So 10th May to now.
The trend line indicates no correlation to slighly worse in 2021. Where is the 98% VE agains death?
The trend line indicates no correlation to slighly worse in 2021. Where is the 98% VE agains death?

5/ Interestingly, there is nothing to see, to a slightly worse situation in 2021 compared to novaxx times in 2020. See trend line which is slightly above the diagonal (not shown, but it would cross the top right corners).

6/ Now the all cause excess defined as
2021 (sum W19 to W45) - 2021 (sum W19 to W45).
age: (left) 65-69, (mid) 70-74, (right) 75-79
males (bottom), females (top)
colour by vaxx rate 65+, size by abs_value(excess).
➡️No💉correlation.
2021 (sum W19 to W45) - 2021 (sum W19 to W45).
age: (left) 65-69, (mid) 70-74, (right) 75-79
males (bottom), females (top)
colour by vaxx rate 65+, size by abs_value(excess).
➡️No💉correlation.

7/ Now the all cause excess defined as
2021 (sum W19 to W45) - 2021 (sum W19 to W45).
age: (left) 80-84, (mid) 85-89, (right) 90+
males (bottom), females (top)
colour by vaxx rate 65+, size by abs_value(excess).
➡️No 💉correlation.
2021 (sum W19 to W45) - 2021 (sum W19 to W45).
age: (left) 80-84, (mid) 85-89, (right) 90+
males (bottom), females (top)
colour by vaxx rate 65+, size by abs_value(excess).
➡️No 💉correlation.

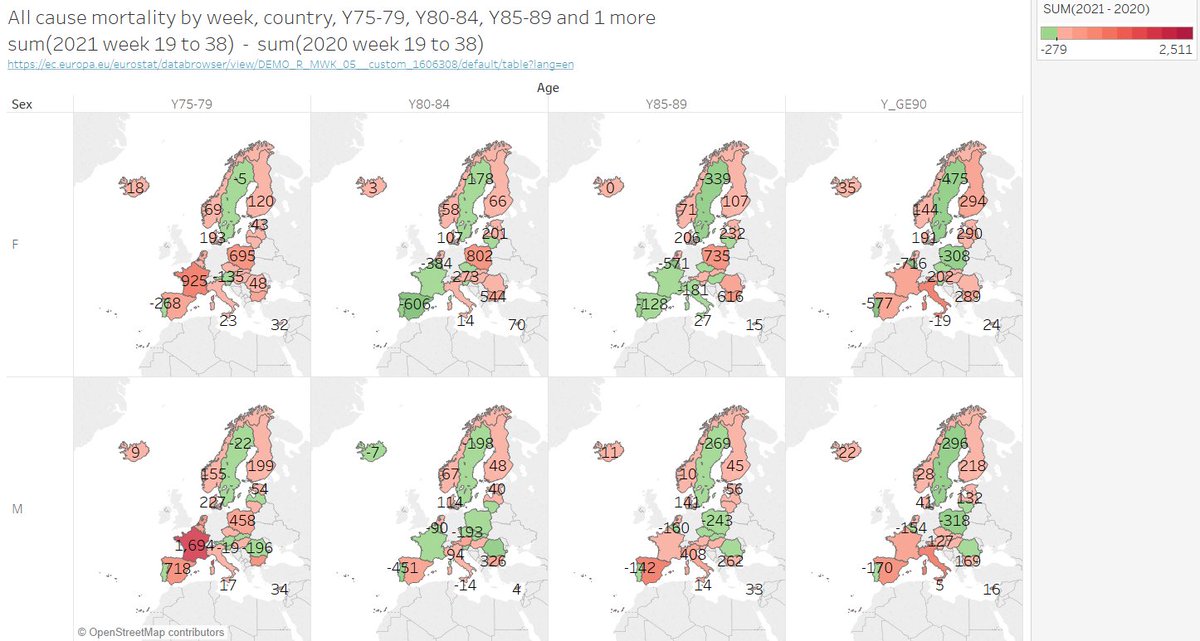
8/ A map view of this excess
2021 (sum W19 to W45) - 2021 (sum W19 to W45).
age: (left) 70-74, (right) 75-79+
males (bottom), females (top)
colour by excess (0 is transition green/red)
➡️ 2021 is worse than novaxx 2020 in general. 🧐
2021 (sum W19 to W45) - 2021 (sum W19 to W45).
age: (left) 70-74, (right) 75-79+
males (bottom), females (top)
colour by excess (0 is transition green/red)
➡️ 2021 is worse than novaxx 2020 in general. 🧐

9/ A map view of this excess
2021 (sum W19 to W45) - 2021 (sum W19 to W45).
age: (left) 80-74, (mid) 85-89, (right) 90+
males (bottom), females (top)
colour by excess (0 is transition green/red)
➡️ looks random. No 💉correlation.🧐
2021 (sum W19 to W45) - 2021 (sum W19 to W45).
age: (left) 80-74, (mid) 85-89, (right) 90+
males (bottom), females (top)
colour by excess (0 is transition green/red)
➡️ looks random. No 💉correlation.🧐

10/ Last experiment: vaxx map and excess side by side.
left: vaxx rate 65+
right 4 maps:
excess 2021 vs 2020.
(left) 65y-69y, (right) 70y-74y
males (bottom), females (top)
colour by excess (0 is transition green/red)
➡️ looks random. No 💉correlation.
left: vaxx rate 65+
right 4 maps:
excess 2021 vs 2020.
(left) 65y-69y, (right) 70y-74y
males (bottom), females (top)
colour by excess (0 is transition green/red)
➡️ looks random. No 💉correlation.

11/ Conclusion: Other risks than vaxx/novaxx dominate everything on all cause death. But reducing all cause is the ultimate goal, or not? It seems not 😌.
Answer B ❌
Answer A, B both possible ✅
Well done followers🏆
Answer B ❌
Answer A, B both possible ✅
Well done followers🏆
https://twitter.com/orwell2022/status/1463455517179850752?s=20

12/ Sorces:
Morality: ec.europa.eu/eurostat/datab…
Vaxx rate: vaccinetracker.ecdc.europa.eu/public/extensi…
Dashboard for download:
public.tableau.com/app/profile/or…
Morality: ec.europa.eu/eurostat/datab…
Vaxx rate: vaccinetracker.ecdc.europa.eu/public/extensi…
Dashboard for download:
public.tableau.com/app/profile/or…
13/ DYI instruction:
1) Query EC DB for 2020 W19-W45, download query SMDX-CSV--> file 2020 (add week and year columns rename OBS column to 2020)
2) Query EC DB for 2020 W19-W45-->download query SMDX-CSV--> file 2021 (add week and year columns, rename OBS column to 2021)
1) Query EC DB for 2020 W19-W45, download query SMDX-CSV--> file 2020 (add week and year columns rename OBS column to 2020)
2) Query EC DB for 2020 W19-W45-->download query SMDX-CSV--> file 2021 (add week and year columns, rename OBS column to 2021)
14 DYI instruction (continued):
3) Create vaxx rate country file (see picture left)
4) Add 2021 and 2021 files in Tableau: left join by age=age, week=week, sex=sex, geo=geo
5) add vaxx rate country file, inner join by geo=geo
3) Create vaxx rate country file (see picture left)
4) Add 2021 and 2021 files in Tableau: left join by age=age, week=week, sex=sex, geo=geo
5) add vaxx rate country file, inner join by geo=geo


2) Query EC DB for 2021 W19-W45-->download query SMDX-CSV--> file 2021 (add week and year columns, rename OBS column to 2021)
Answer A, C I meant 😅
15/ Update (correction): I overlooked that the end week of reporting for 2021 varies for countries. Not all have W45. All have W38.
So this UNDERESTIMATED the 2021 excess for some countries (as the sum for 2020 went to W45).
Again for W19-W38.
➡️Answer C, may have it.
So this UNDERESTIMATED the 2021 excess for some countries (as the sum for 2020 went to W45).
Again for W19-W38.
➡️Answer C, may have it.

16/ Here again the raw correlations:
Filter on: W19 to W38
Filter on: W19 to W38


17/ And here again the excess defined as
2021 (sum W19 to W38) - 2021 (sum W19 to W38).
age: (left) 65-69, (mid) 70-74, (right) 75-79
males (bottom), females (top)
colour by vaxx rate 65+, size by abs_value(excess).
2021 (sum W19 to W38) - 2021 (sum W19 to W38).
age: (left) 65-69, (mid) 70-74, (right) 75-79
males (bottom), females (top)
colour by vaxx rate 65+, size by abs_value(excess).

18/ And here the excess defined as
2021 (sum W19 to W38) - 2020 (sum W19 to W38).
age: (left) 80-84, (mid) 85-89, (right) 90+
males (bottom), females (top)
colour by vaxx rate 65+, size by abs_value(excess)
2021 (sum W19 to W38) - 2020 (sum W19 to W38).
age: (left) 80-84, (mid) 85-89, (right) 90+
males (bottom), females (top)
colour by vaxx rate 65+, size by abs_value(excess)

19/ Last one, the corrected map for the above 80 years.
Well...Sweden shines green. The rest doesn't look good compared to 2020.
Lockdowns are not good for health. The 💉doesn't improve anything (so far, up to W38). Tbc...
Well...Sweden shines green. The rest doesn't look good compared to 2020.
Lockdowns are not good for health. The 💉doesn't improve anything (so far, up to W38). Tbc...
21/ Next: normalization by population.
ec.europa.eu/eurostat/datab…
2019 is available by age, sex, country by 1 year bins.
I created a new set to match the EC 5 year bins of the mortality table. Cc @OS51388957 @USMortality
public.tableau.com/authoring/EC_p…
files.catbox.moe/rjn918.csv
ec.europa.eu/eurostat/datab…
2019 is available by age, sex, country by 1 year bins.
I created a new set to match the EC 5 year bins of the mortality table. Cc @OS51388957 @USMortality
public.tableau.com/authoring/EC_p…
files.catbox.moe/rjn918.csv
22/ Yep, good to check things. I forgott about M/F.
files.catbox.moe/y1eclz.csv
@OS51388957
I will start a new thread once I have cross checked the dashboard.
files.catbox.moe/y1eclz.csv
@OS51388957
I will start a new thread once I have cross checked the dashboard.

23/ Finally: crosscheck.
1) Manual excel check and Tableau ✅
2) Population in ec.europa.eu/eurosta (after aggregation to 5 year bins) seem to fit with populationpyramid.net/austria/2019/
@OS51388957
1) Manual excel check and Tableau ✅
2) Population in ec.europa.eu/eurosta (after aggregation to 5 year bins) seem to fit with populationpyramid.net/austria/2019/
@OS51388957


• • •
Missing some Tweet in this thread? You can try to
force a refresh


