Jason Furman Profile picture
Nov 24, 2021 10 tweets 5 min read Read on X
Today's personal consumption data gives the most detailed picture of where consumers are now.

And the answer is: overall consumption is back, the goods-services disconnect is still large, but mostly that is because goods are high and rising even while services partly recover.
Here is real spending on goods and goods. Note that real services spending has been *rising* even while services spending is recovering.
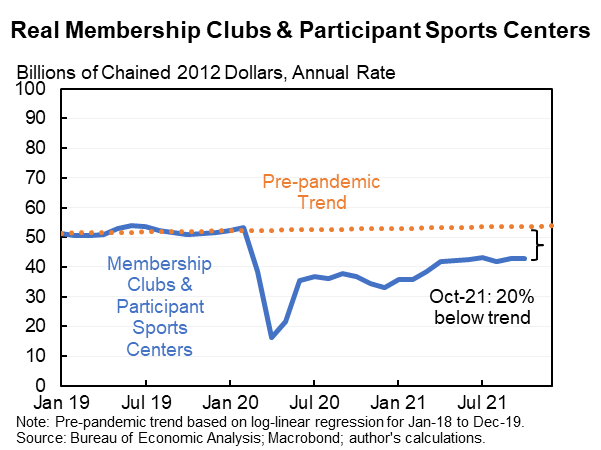
Look at spending on sporting equipment, guns & ammunition vs. membership clubs and sports center. The former is high and the later is low. But the goods spending is still rising even while the services is roughly flat.
Same story with personal care products vs. personal care services.
And my favorite, people kept buying a lot in supermarkets even as their restaurant spending returned to normal. I've tweeted about that before.
Also remember that the biggest shortfall in services is health. This isn't quite the same as people choosing not to go to gyms or manicures. And may not have the same obvious micro substitution. Although even ex health and nonprofits (which are in PCE), services below trend.
So overall the composition shift is clearly part of the story (people buying goods instead of services). But it's only part--as goods spending keeps rising while services is flat or recovering. So there is also a big demand increase (is screamingly clear in the nominal data).
We do still have an issue with the composition of consumption in our economy. As it shifts we're likely to see some falloff in goods inflation and some rise in services inflation. I expect that will mean lower inflation overall but is not obvious.
In fact, in Q3 the biggest shortfall in the economy was not consumption (which gets most of the attention) but business investment. With new orders so high this investment gap also may be closing rapidly.
Finally, here is a full table about what is up or down relative to trend in the consumption components--and how those contribute to the overall numbers. Enjoy!

• • •

Missing some Tweet in this thread? You can try to force a refresh
 

Keep Current with Jason Furman

Jason Furman Profile picture

Stay in touch and get notified when new unrolls are available from this author!

Read all threads

This Thread may be Removed Anytime!

PDF

Twitter may remove this content at anytime! Save it as PDF for later use!

Try unrolling a thread yourself!

how to unroll video
  1. Follow @ThreadReaderApp to mention us!

  2. From a Twitter thread mention us with a keyword "unroll"
@threadreaderapp unroll

Practice here first or read more on our help page!

More from @jasonfurman

Mar 3
The Atlanta tracker is predicting GDP growth of -2.8% in Q1.

S&P, which I generally trust a lot, is at 1.6%. Goldman is also at 1.6%.

Atlanta likely wrong. And regardless doesn't say what you think it does.

So continue your deep breathing.
To understand what I think is going wrong with Atlanta you need to understand that imports show up twice in the national accounts--cancelling out.

You might know that GDP = C + I + G + X - M

If you import a Japanese car then M goes up. You might think that lowers GDP but...
The imported car also shows up as a + in GDP, cancelling out the - import.

If it is imported for use by a family, business or government then it shows up in C, I or G respectively.

If a business imports it & no one buys it then it is increased inventory, which shows up in I.
Read 12 tweets
Mar 3
Given the renewed interest in national income accounting a brief primer on the role of government spending in GDP.

Short version: (1) critical to include govt for accounting identities but (2) can debate welfare-relevant metric or best forecasting "signal".

A 🧵. Image
Three identical ways to think about the size of the economy:

1. Final expenditures (including consumers, businesses and government)

2. Incomes (including wages and profits)

3. Production (value added or final production) khanacademy.org/economics-fina…Image
If a consumer, business or govt buys a US-made car that counts in the expenditure portion of GDP as C, I or G.

The wages of the auto worker or the profits of the auto company show up in the income version.

And the auto companies making a car shows up in the production version.
Read 12 tweets
Feb 28
Core PCE inflation in January, annual averages:

12 months: 2.6%
6 months: 2.6%
3 months: 2.4%
1 month: 3.5%

This was as expected, consistent with a very gradual slowing, and ~2.5% underlying inflation. Image
Here are the full set of numbers. Image
On the favorable side of the ledger, market-based core inflation--which is a better predictor of future inflation than regular core--has been somewhat lower. This excludes things like implied price of portfolio management fees. Image
Read 7 tweets
Feb 23
COVID ripped apart economies around the world. Amazingly most rich countries snapped back almost completely very quickly. By the end of 2021, 12 of 27 advanced OECD economies had unemployment rates below pre-COVID forecasts. The US did not. In fact, it was the fourth worst.

A 🧵 Image
This🧵looks at unemp rates cross countries. I'll do another w/ GDP growth across countries which tells a similar story.

But unemp rates preferable because a cleaner answer speed/fullness of RECOVERIES. Growth differences can be more structural (e.g., productivity & demography).
My aim in this and the thread that I'll post later is to be much more systematic than @Noahpinion was in his response to my @ForeignAffairs piece. He had some good arguments there but his international macro comparisons were, at best, unsystematic. noahpinion.blog/p/anti-anti-ne…
Read 15 tweets
Feb 10
I have a new piece in @ForeignAffairs titled, "The Post-Neoliberal Delusion and the Tragedy of Bidenomics". They were generous about giving me a lot of words but were less generous with charts--so this long thread partially rectifies that. (And links to the piece at the end.) Image
@ForeignAffairs First let me say some good policy came out of the Biden administration, including on climate and microchips. And more good policy would have come out if it wasn't blocked by unified Republican opposition.

But...
@ForeignAffairs Also some tragically misguided policy, not least the oversized stimulus. But also the first Democratic President in 100 years not to permanently expand the social safety net plus a reduction in inflation-adjusted infrastructure investment and support for children.
Read 25 tweets
Jan 15
Inflation came in below expectations but still a touch on the high side.

Core CPI annual rate:
1 month: 2.7%
3 months: 3.3%
6 months: 3.2%
12 months: 3.2% Image
Shelter inflation was moderate and the three month moving average continues to basically trend down, albeit slowly. Image
But you can't just assume elevated items like shelter will get better but that everything opposite won't get worse.

And that's what we've (predictably and predicted) seen: goods inflation was negative for a while but turned positive for 4 straight months. Offset shelter cooling. Image
Read 8 tweets

Did Thread Reader help you today?

Support us! We are indie developers!


This site is made by just two indie developers on a laptop doing marketing, support and development! Read more about the story.

Become a Premium Member ($3/month or $30/year) and get exclusive features!

Become Premium

Don't want to be a Premium member but still want to support us?

Make a small donation by buying us coffee ($5) or help with server cost ($10)

Donate via Paypal

Or Donate anonymously using crypto!

Ethereum

0xfe58350B80634f60Fa6Dc149a72b4DFbc17D341E copy

Bitcoin

3ATGMxNzCUFzxpMCHL5sWSt4DVtS8UqXpi copy

Thank you for your support!

Follow Us!

:(