1/7
A thread about the latest with COVID.
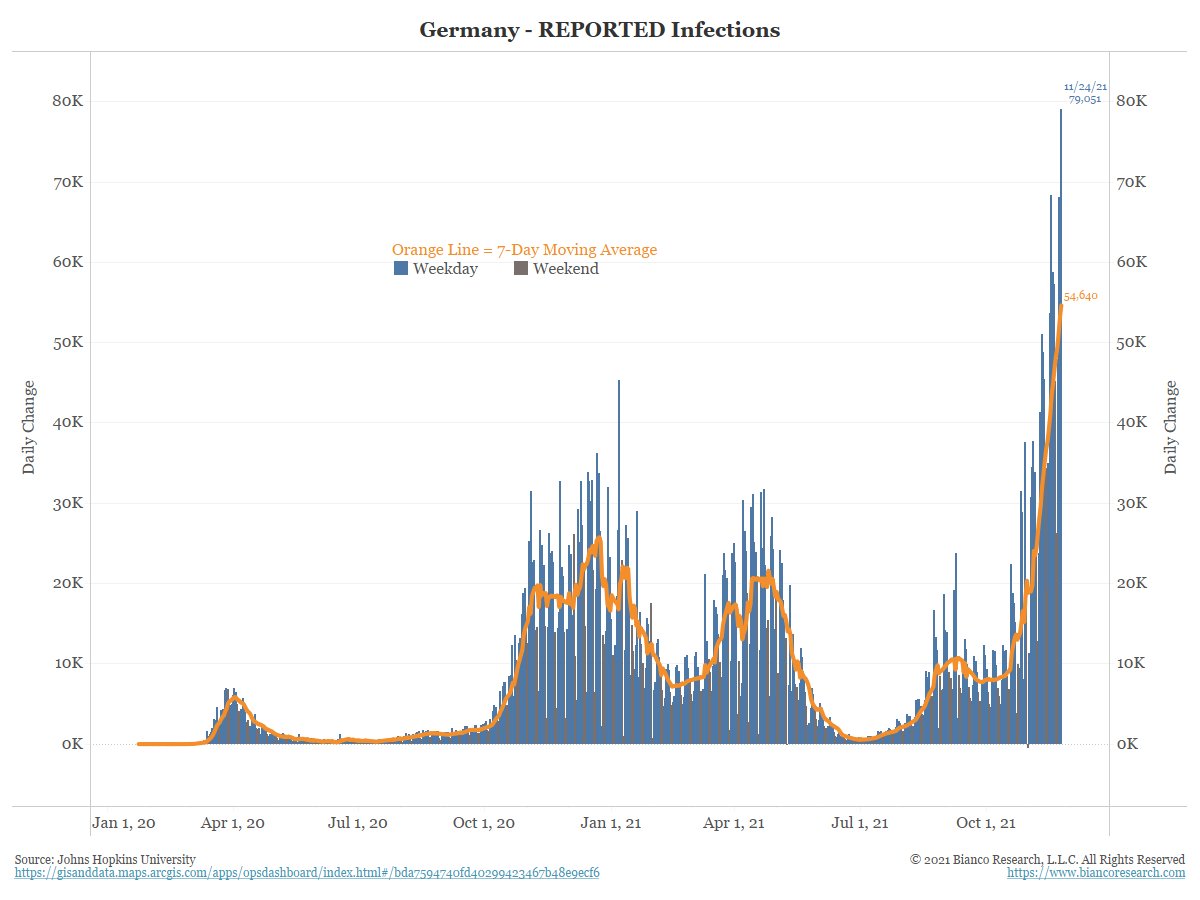
Europe' case counts hit a new all-time, as did Germany.
Lockdowns, restrictions, and protests (sometimes violent) are everywhere in Europe.
A thread about the latest with COVID.
Europe' case counts hit a new all-time, as did Germany.
Lockdowns, restrictions, and protests (sometimes violent) are everywhere in Europe.

2/7
The world hit a new 10 week high yesterday, and cases are going vertical (orange) line.
The world hit a new 10 week high yesterday, and cases are going vertical (orange) line.

3/7
And the US is now moving up, no mistake about it (orange line in the last few weeks).
And, as we have noted before, whenever cases spike in one area, they eventually spike in other area.
And the US is now moving up, no mistake about it (orange line in the last few weeks).
And, as we have noted before, whenever cases spike in one area, they eventually spike in other area.


4/7
Europe is spiking now even though they have higher vaccine rates than the US
Europe is spiking now even though they have higher vaccine rates than the US

5/7
Michigan has the highest case count in the US.
In fact it is making a new all-time high in cases per 100,000.
Michigan has the highest case count in the US.
In fact it is making a new all-time high in cases per 100,000.

6/7
Why bring up Michigan?
Because in 1-hour the Detroit Lions play the Chicago Bears in front of 65,000 maskless screaming fans in DOME STADIUM (read: indoor) Ford Field in Detroit.
Remember a year ago, when case counts were LOWER, they had to play this game with no fans.
Why bring up Michigan?
Because in 1-hour the Detroit Lions play the Chicago Bears in front of 65,000 maskless screaming fans in DOME STADIUM (read: indoor) Ford Field in Detroit.
Remember a year ago, when case counts were LOWER, they had to play this game with no fans.
7/7
Oh ... and in 48 hours #6 Michigan plays #2 Ohio State in "The Big House" in Ann Arbor. So another 110,000+ maskless fans screaming in the state with the highest case count in the country, and higher than last year's lockdowns.
Are we still following the science???
Oh ... and in 48 hours #6 Michigan plays #2 Ohio State in "The Big House" in Ann Arbor. So another 110,000+ maskless fans screaming in the state with the highest case count in the country, and higher than last year's lockdowns.
Are we still following the science???
• • •
Missing some Tweet in this thread? You can try to
force a refresh