These are subject to a number of assumptions (and uncertainties), of course. Allowing net-negative emissions expands remaining budgets, while more convex (or concave) emissions pathways would change the date at which zero emissions needs to be reached:
Assumptions around non-CO2 GHG emissions and aerosols also matter. The IPCC provides a best estimate (and uncertainties), but more pessimistic or optimistic assumptions for non-CO2 forcings would reduce or expand the remaining carbon budgets accordingly. 3/
The IPCC AR6 largely had the same carbon budgets as in the older IPCC SR15 report for 50% likelihood, but increased the remaining budget for 66% likelihood outcomes reflecting the narrowing of the range of likely climate sensitivity in the AR6: carbonbrief.org/analysis-what-… 4/
There were lots of other changes "under the hood" to budgets in AR6, including a reassessment of differences between ocean surface and air temperature warming differences, the inclusion of earth system feedbacks, etc. For more details see @JoeriRogelj
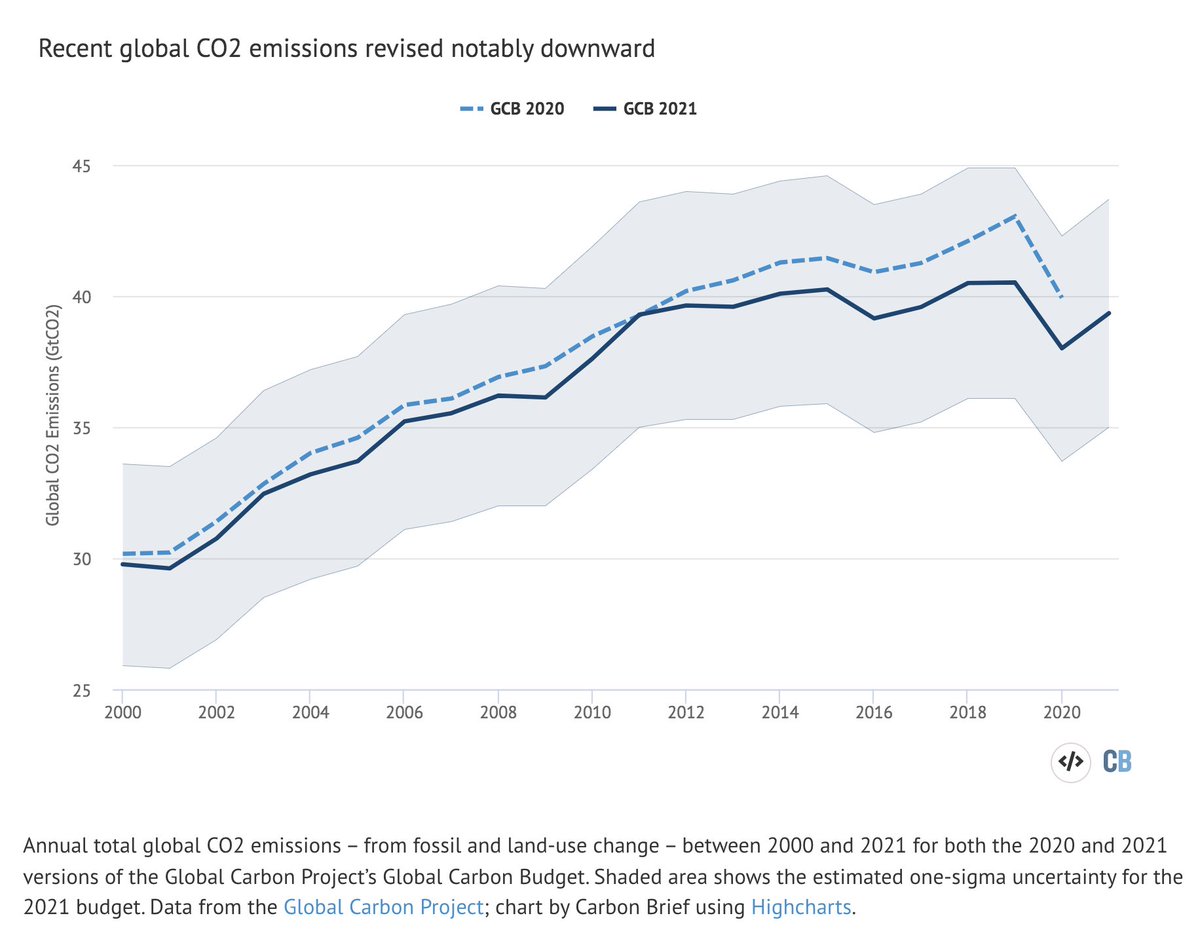
We can also compare these simple emissions pathways to those I created back in 2020 (dashed lines) based on the SR15 and emissions data available at the time. A few notable things stand out:
First, historical emissions were reassessed downwards in the latest emissions data from @gcarbonproject. For example, 2019 emissions went from 43 GtCO2 to 40.5 GtCO2. Second, while 50% pathways did not change, the 66% ones became more gradual reflecting the increase in budgets 7/
(note that the TCRE-based diagram in the linked tweet is somewhat inconsistent with budget-based calculations here as it does not account for any future changes in non-CO2 forcings, but its intended to be illustrative of the impact of convex pathways rather than prescriptive)
• • •
Missing some Tweet in this thread? You can try to
force a refresh
The EPA cited my paper in their argument against the endangerment finding today. However, their point is completely backwards: my paper actually supports the EPA's 2009 range of 1.8C to 4C warming by 2100. nature.com/articles/d4158…
Specifically, in our paper we argue that RCP4.5 or RCP6.0 are more realistic representations of 2100 warming under current policy than the increasingly implausible RCP8.5 scenario. But the lower of those two – RCP4.5 – gives a 2100 warming range of 1.8C to 4C!
Its only the high end warming outcomes of >4C that have become increasingly unlikely as the world has moved toward lower emissions scenarios. The wide range of climate sensitivity and carbon cycle feedbacks still makes it impossible to rule out up to 4C: journals.sagepub.com/doi/10.1177/29…
I just published an explainer on aerosols and their role in the climate that I've been working on for the past few months! It includes both how aerosols work, how emissions have changed, and how thats driven recent warming (link below).
Human-caused emissions of aerosols – tiny, light‑scattering particles produced mainly by burning fossil fuels – have long acted as an invisible brake on global warming. This is largely because they absorb or reflect incoming sunlight and influence the formation and brightness of clouds.
Aerosols also have a substantial impact on human health, with poor outdoor air quality from particulate matter contributing to millions of premature deaths. Efforts to improve air quality around the world in recent decades have reduced aerosol emissions, bringing widespread benefits for health.
Whenever I post about climate, skeptical folks inevitable respond with this graph. So I decided to do something radical: actually read the underling scientific paper and ask the authors.
As it turns out, it actually says the opposite of what skeptics claim.
Rather than arguing against human influence on the climate, the paper makes the stark claim that "CO2 is the dominant driver of Phanerozoic climate [the past 485 million years], emphasizing the importance of this greenhouse gas in shaping Earth history."
Changes in temperature, it turns out, have been strongly correlated with CO2. Even more strongly than the authors expected when they set out to create a 485 million year reconstruction. CO2 is both a forcing (e.g. from volcanism) and a feedback (from solar forcing) at different points.
Every wildfire starts with an ignition – downed powerlines, lightning, arson – and we can do a lot to reduce these.
But in California the number of fires has dropped while the area burned has doubled. What has changed is conditions, not ignitions:
Why have conditions changed? A legacy of poor forest management has led to fuel loading (particularly in the Sierras), contributing to more destructive fires. But vegetation has also gotten much drier as fire season temperatures have warmed (+3.6F since 1980s)
We've historically seen the most destructive fires in hot and dry years. Human emissions of CO2 and other greenhouse gases are the primary cause of increased temperatures in California.
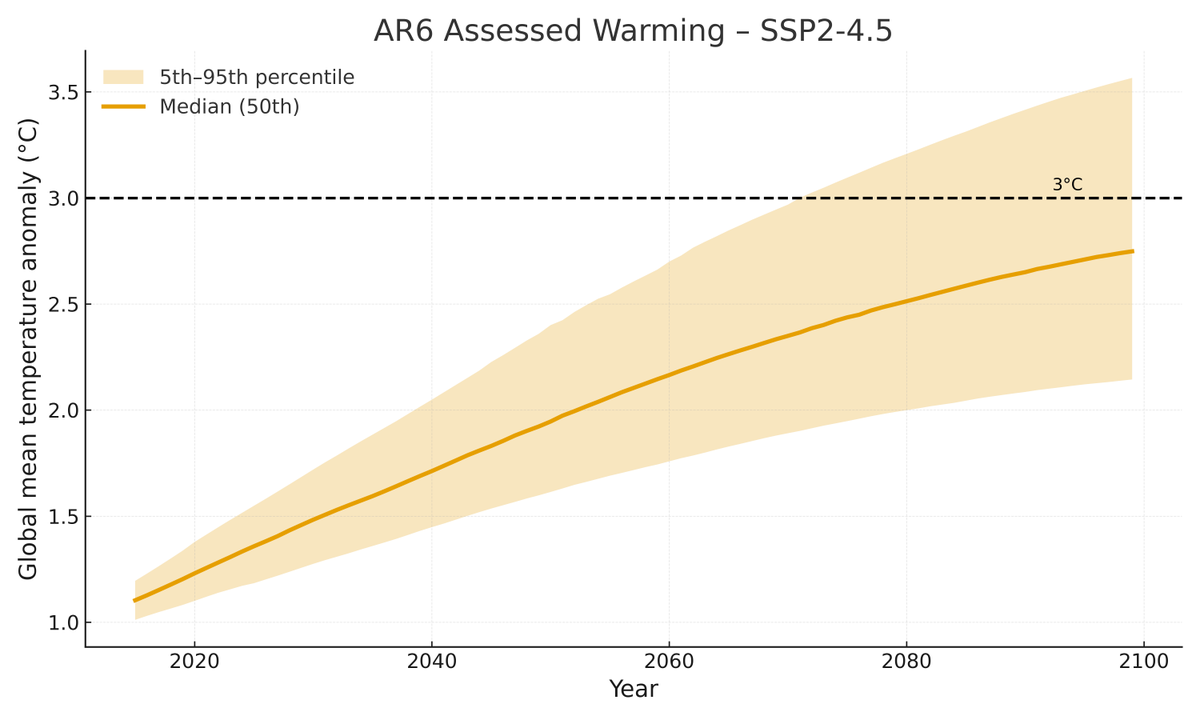
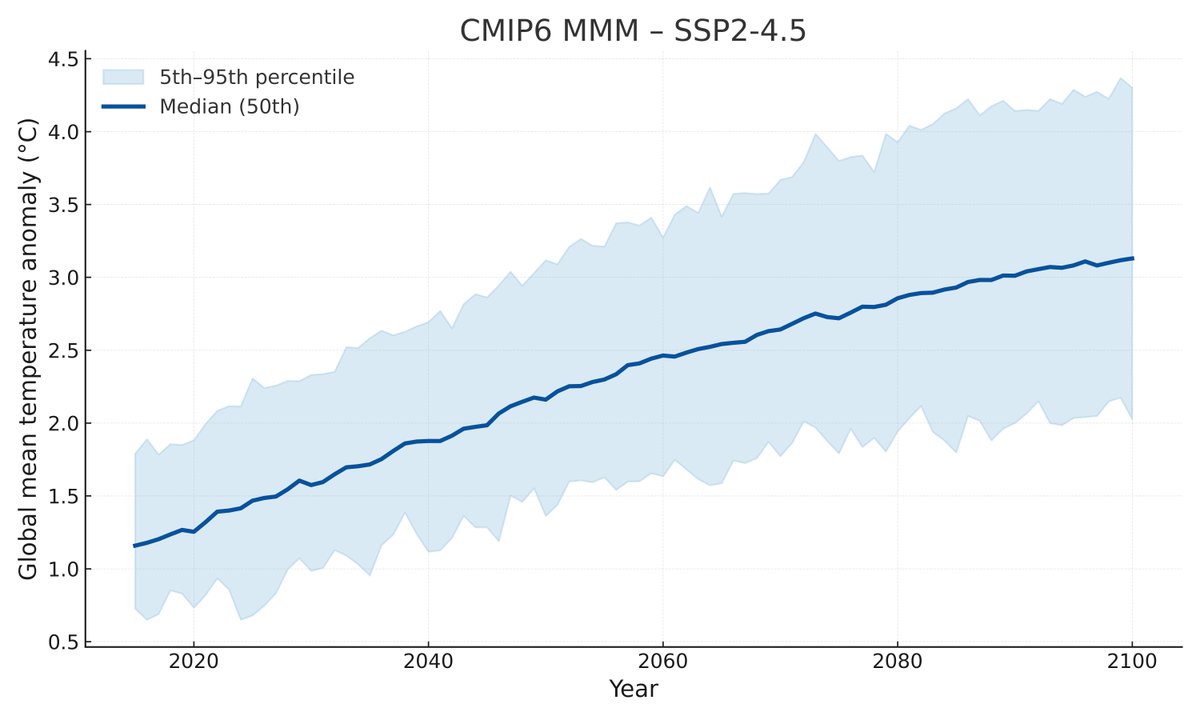
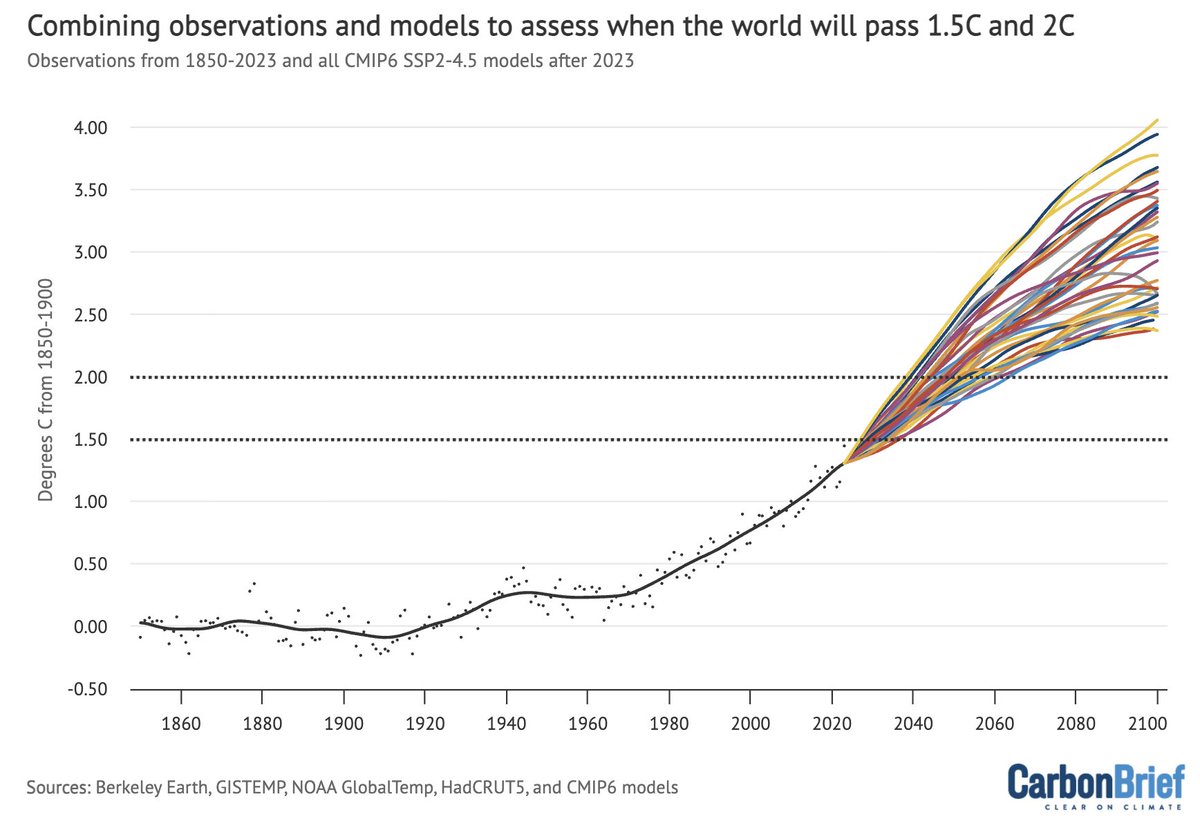
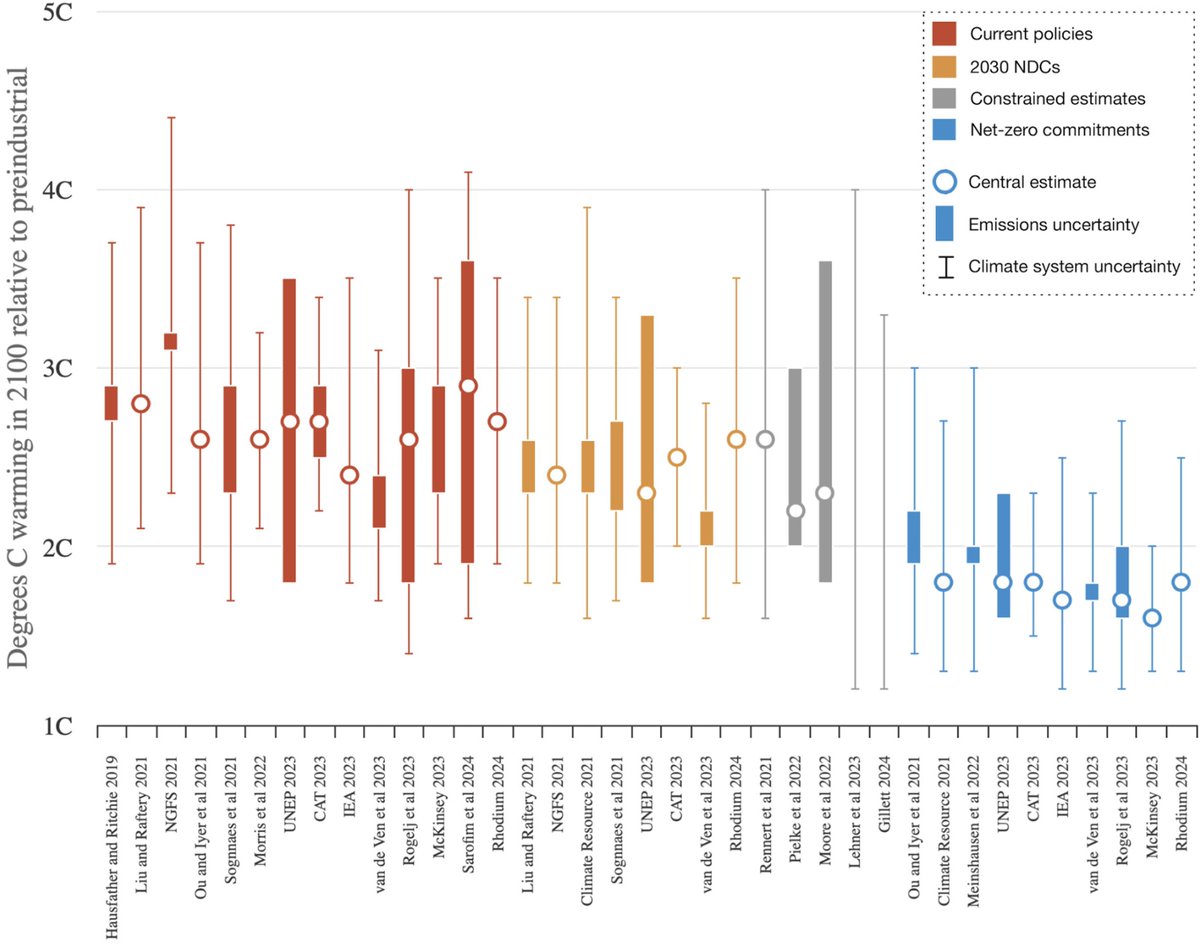
I have a new paper in Dialogues on Climate Change exploring climate outcomes under current policies. I find that we are likely headed toward 2.7C by 2100 (with uncertainties from 1.9C to 3.7C), and that high end emissions scenarios have become much less likely
This reflects a bit of good news; 2.7C is a lot better than the 4C that many thought we were heading for a decade ago, and reflects real progress on moving away from a 21st century dominated by coal. At the same time, its far from what is needed.
It does raise an interesting question: how much of the change in likely climate outcomes relative to a decade ago reflects actual progress on technology and policy vs assumptions about the future (e.g. 5x more coal by 2100) that were always unrealistic.
I have a new analysis over at The Climate Brink exploring how rates of warming have changed over the past century.
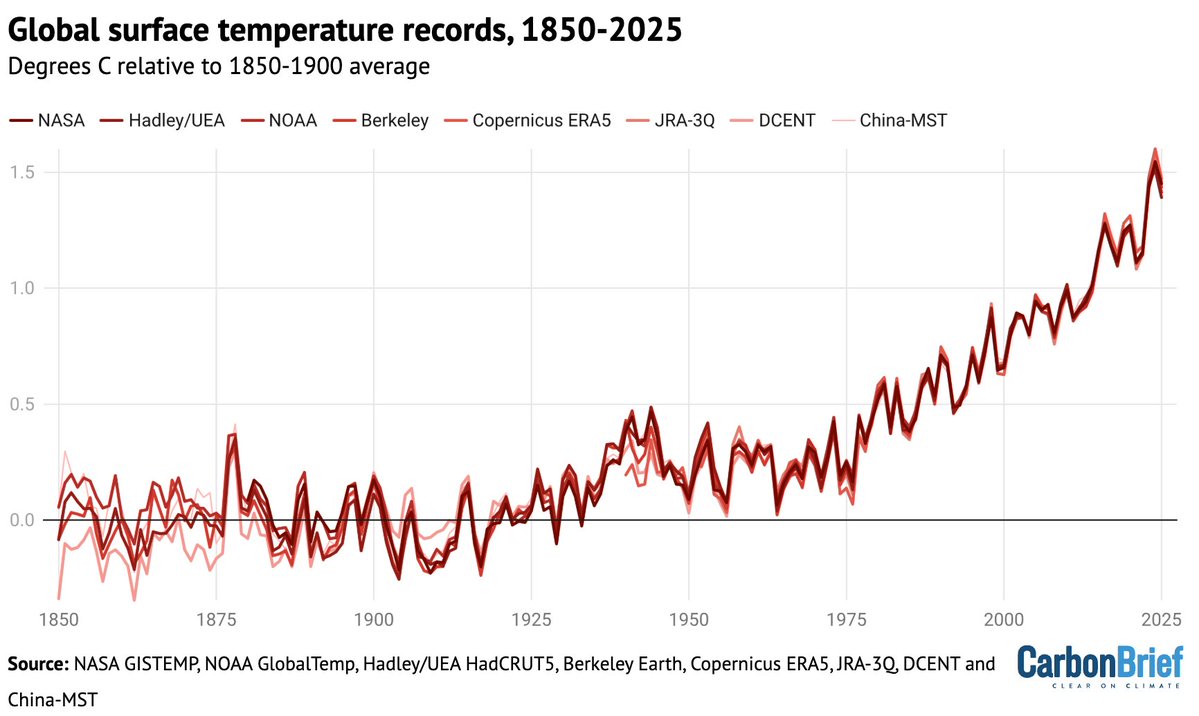
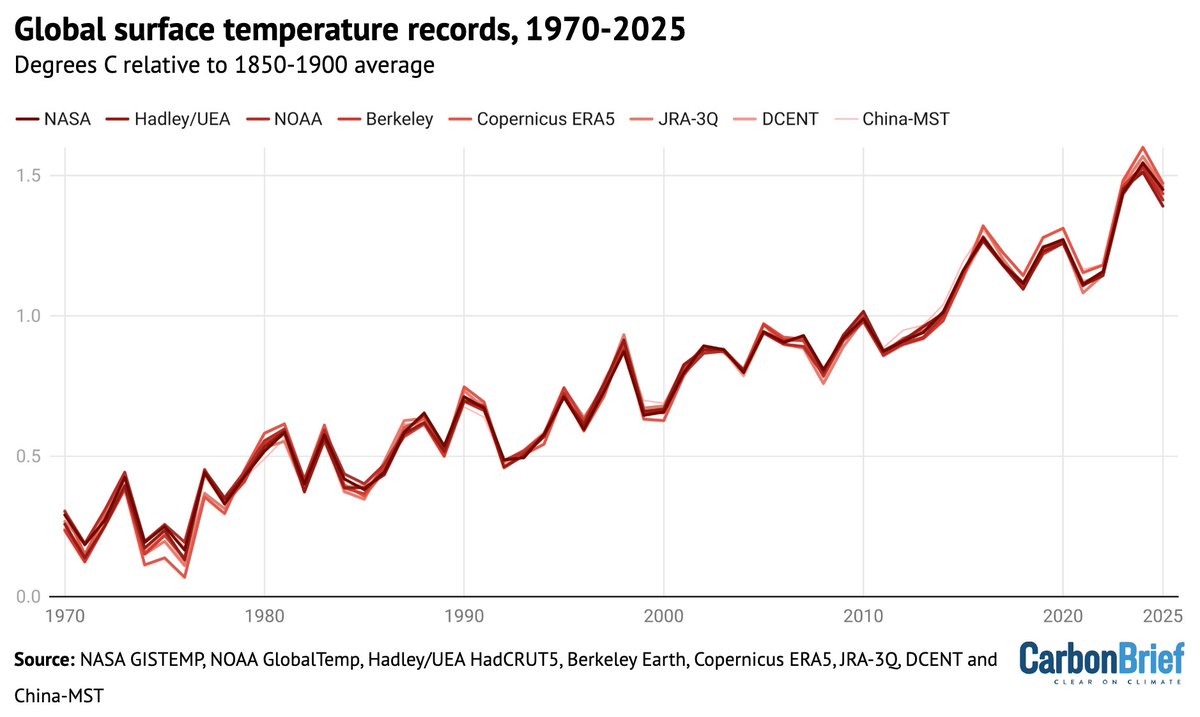
Post-1970, GHGs (CO2, CH4, etc.) would have led to just under 0.2C per decade, but falling aerosols (SO2) have increased that rate to 0.25C.
These falling aerosols have "unmasked" of some of the warming that would have otherwise occurred due to past emissions of greenhouse gases. Its been driven by large declines in Chinese and shipping SO2 emissions over the past decade, among other contributors.
Now, a flat rate of warming from GHGs at just under 0.2C per decade might seem a bit unexpected. After all, CO2 emissions have continued to increase, and atmospheric CO2 concentrations have grown year over year.