Another good news day in Minnesota’s #COVID19 reports: raw cases and positivity rate both trended down today. Our 7-day average positivity rate is now down to 8.8%.

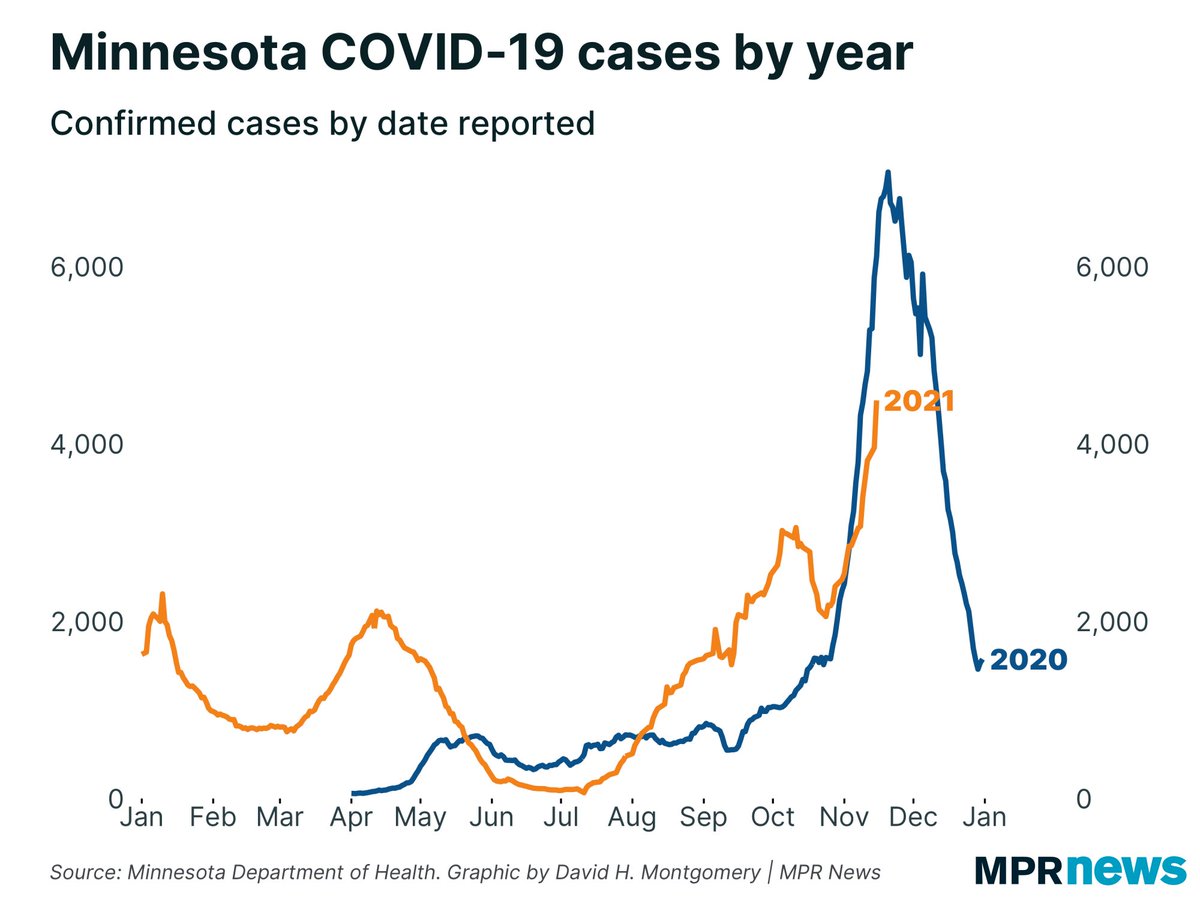
A LOT could change, but right now it looks like we might have peaked circa Nov. 15.
That said, remember all our data is still messy due to the holidays. Case in point: deaths, which weren’t reported yesterday due to holiday staffing issues.

That meant @mnhealth reported 100 deaths today — a huge number — but that represents multiple days of data. Trend is flat
@mnhealth Deaths are actually down slightly from our peak last week, but this dataset is messy enough it’s too early to call a peak yet.
Reported #COVID19 hospital admissions have actually dipped a little, which isn’t implausible given cases apparently peaking a few weeks ago.

No sign of a drop yet in bed occupancy stats.
As of today’s report, 69% of Minnesota residents have at least one vaccine dose.
That includes 23% of 5-11-year-olds, and more than 60% of every other age group. (Except 0-4-year-olds, who are of course at 0%.)
Some big news today. @mnhealth has finally — after more than a year of requests on my part — started published #COVID19 testing data by sample date.

That means we can calculate sample-date positivity rate!
@mnhealth That said, sample-date positivity rate largely tracks report-date positivity, with three key differences:

1) Given reporting delays, report-date data lags sample-date data.
2) Sample-date data is smoother due to lack of reporting issues.
3) Sample-date data has a 1-week delay.
@mnhealth In the long run, sample-date is by far the best way to track the course of #COVID19 in Minnesota.

That said, it’s not ideal for tracking what’s new TODAY, so I’ll continue sharing positivity by report-date.

• • •

Missing some Tweet in this thread? You can try to force a refresh
 

Keep Current with David H. Montgomery

David H. Montgomery Profile picture

Stay in touch and get notified when new unrolls are available from this author!

Read all threads

This Thread may be Removed Anytime!

PDF

Twitter may remove this content at anytime! Save it as PDF for later use!

Try unrolling a thread yourself!

how to unroll video
  1. Follow @ThreadReaderApp to mention us!

  2. From a Twitter thread mention us with a keyword "unroll"
@threadreaderapp unroll

Practice here first or read more on our help page!

More from @dhmontgomery

30 Nov
Remember yesterday when I said cases were really low, but this was due to the holiday and we should probably expect a bounceback?

Today’s the bounceback. Numbers today will look scary, but they’re not, really — it’s just a consequence of when things are reported.
Yesterday’s report had 4,511 new cases, 4.34% positive.

Today was 12,632 cases & 17.29% (!) positive.

BUT: if you take the two days together, it’s a 9.7% positivity rate, in line with recent trends. Our 7-day average positivity rate is BELOW where it was at the end of last week ImageImage
As of Friday’s report, MN was averaging 4,175 new cases per day, and a 9.19% positivity rate.

Today, after yesterday’s fall and today’s rise, we’re at 3,576 cases per day and 9.05%.

Follow the general trend — smooth out the spikes and it’s one of moderate decline. Image
Read 11 tweets
29 Nov
#COVID19 data is going to be very messy the next week or two because of Thanksgiving. Not only did the holiday mess up when data is REPORTED, it also messed up how the data is collected. Ordinarily MN has tens of thousands of new COVID tests conducted on a Thursday….
Also @mnhealth isn’t reporting any vaccination data today. We’ll see how my scripts handle that…
Case in point of the weird data: today’s MN #COVID19 report has more than 104,000 total tests. That’s double what we reported last Monday, but of course the holiday means it’s not apples-to-apples.
Read 14 tweets
16 Nov
Today’s #COVID19 report in Minnesota was always going to be bad — last Tuesday was artificially mild due to data delays; yesterday’s deaths were all reported today.

But still, this is rough. Minnesota’s average positivity rate has crossed back over 10%.
Today’s report is actually the single worst #COVID19 report we’ve ever had, with more than 10,000 new cases. BUT this report includes 3 days of data; the 9,000-case days last November were single days.

Still, our average is up sharply, and relatively closely tracking last fall.
#COVID19 hospitalizations are also rising quickly.
Read 8 tweets
15 Nov
#COVID19 metrics are all going up in MN. How much is a little harder to say. Our relative increases in today’s were less drastic than we reported last Monday. If that’s actually signs of a slowdown, that’s good. But the Veterans Day holiday could be skewing things. Wait & see.
Tests conducted last Monday in Minnesota (and thus not skewed by reporting issues) reported nearly 6,000 #COVID19 cases. That’s the most from any one day of testing here since Dec. 1, 2020. (Note this sample-date data has a one-week lag time to stabilize.)
#COVID19 death data is useless today in MN because of Veterans Day. The health department reports 0 new deaths, but that’s just because no deaths were processed on Veterans Day (and today’s report is as of 4 a.m. on Friday). Tomorrow will see a big spike, then hopefully stability
Read 7 tweets
12 Nov
I wish I had good news for you, Minnesota, but #COVID19 cases are growing rapidly — at basically the pace we saw this time last year.

Positivity rate is also rising, perhaps slightly less dramatically, but still at an aggressive pace. We’re now over 9%.
Hospitalizations are also surging upward, for you “cases don’t matter” people. (They do matter, because there’s clearly still a tight statistical relationship between cases and more serious metrics like hospitalizations and deaths.)
Hospitalizations are rising everywhere, but especially rapidly in metro-area hospitals.
Read 21 tweets
11 Nov
No end in sight for Minnesota’s latest #COVID19 surge.

Cases: up, averaging 3,600/day
Positivity: up, to 8.9%
Hospital bed use: up, to 1,125 ImageImageImage
Today’s data does include about 1,000 slightly backlogged cases from the weekend, but even if you subtract those, we’re still up significantly week-over-week.
It’s worth noting that cases ARE up more dramatically than positivity rate, indicating that a least some of our case growth may be driven by expanded testing. But positivity rate is still up 34% (or more than 2 percentage points) in the past two weeks. Image
Read 9 tweets

Did Thread Reader help you today?

Support us! We are indie developers!


This site is made by just two indie developers on a laptop doing marketing, support and development! Read more about the story.

Become a Premium Member ($3/month or $30/year) and get exclusive features!

Become Premium

Too expensive? Make a small donation by buying us coffee ($5) or help with server cost ($10)

Donate via Paypal

Or Donate anonymously using crypto!

Ethereum

0xfe58350B80634f60Fa6Dc149a72b4DFbc17D341E copy

Bitcoin

3ATGMxNzCUFzxpMCHL5sWSt4DVtS8UqXpi copy

Thank you for your support!

Follow Us on Twitter!

:(