Willie Powell & my blog on today's (confusing) jobs numbers. We put the last year in context. Contrary to widespread belief, job growth has been near expectations--as surprisingly strong labor demand offsets surprisingly weak labor supply. A 🧵 piie.com/blogs/realtime…
To understand what was expected we use the median forecast from the Survey of Professional Forecasters. Other forecasts were similar. Overall, has slightly outpaced. Here is avg monthly jobs for 2021:
Nov 2020 forecast: 432K/month
May 2021 forecast: 562K/month
Actual: 555K/month
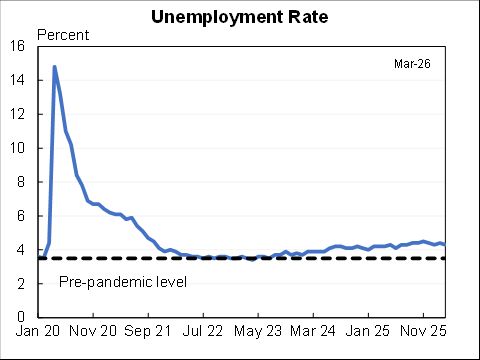
Similar story for unemployment. Back in May (the first forecast that incorporated the American Rescue Plan) the SPF expected the UR to be about 4.9% in Nov, instead it was 4.2%.
(Note, they don’t forecast labor force participation but likely would be worse than expected.)
But not everything has played out as expected, there have been two big surprises: a decline in labor supply and an increase in labor demand. They've roughly offset each other for employment but both have led to higher nominal wages.
(Technical note: we think of labor supply/demand as functions of *real* wages. I'm showing nominal due to a combo of wage illusion and expectation of transitory inflation. Both assumptions becoming increasingly untenable.)
Willie and I decompose the 1.5 pp decline in LFPR since COVID hit and find it is roughly one-third due to population aging, one-fifth due to ongoing weakness, and nearly half is "other." That "other" is both men and women, working age and retirement age.
At the same time there were 0.6 unemployed per job opening, a very tight labor market by that metric.
Different labor market indicators sending different signals. EPOP is still relatively slack, UR more balanced, & U/V and quits very tight. Which is right? The latter two have a lot of merit and worth taking seriously as Willie & I discussed before piie.com/blogs/realtime…
The net result of this is nominal wages well above trend, something unusual if all you looked at is unemployment. Overall, those gains are being eaten by inflation—except for lower-wage workers who are seeing real gains, albeit at a slower pace than before COVID.
Overall, the economy is 5 million jobs short of where it was expected to be prior to COVID. The gap is closing but fiscal and monetary policy should still be accommodative—as they are very likely to be. FIN.
• • •
Missing some Tweet in this thread? You can try to
force a refresh
It has now, for better or worse, been effectively abolished.
The last three legislated increases in the minimum wage were bipartisan:
1989: President Bush (41) and a Democratic Congress
1996: President Clinton and a Republican Congress
2007: President Bush (43) and a Democratic Congress
Prices are up about 50% since it was increased to $7.25/hr in 2009.
As a result the inflation-adjusted minimum wage is about the lowest it has ever been. The productivity-adjusted min wage is the lowest it has ever been.
Only 1% of workers nationwide are paid at or below that.
The most helpful visualization of the persistent and, to some degree, resurgence of core inflation is this. Four straight months of strong core goods inflation largely due to tariffs. Plus services inflation remains reasonably strong.
A big upward revision for GDP, was a 3.8% annual rate (up from 3.0% in the advance estimate). For H1 GDP up at a 1.6% annual rate.
The biggest change was consumption which was 2.5% annual rate (up from 1.4% in the advance). Business fixed investment strong, residential weak.
Here is quarterly consumer spending. It looked like it was really slowing but with this upward revision and the July and August indications it's looking much more healthy.
Business fixed investment has been strong. It is unclear how much of this is pulling forward of capital equipment imports to get ahead of tariffs and how much is sustainable. (Note disaggregating structures have been falling while equipment is rising, reducing a disconnect.)
The problem recently has been in both goods and services. Core goods inflation has typically been about zero but in the run-up to this year had deflation. Now tariff-driven inflation.
And at the same time core services inflation has picked up.
A market slowdown in the pace of job gains, with 22K added in August, bringing the three month average to 29K.
On a percentage basis have not seen job growth this slow outside of recessionary periods in more than sixty years.
The unemployment rate rose from 4.2% to 4.3% (unrounded was a smaller increase).
Wage growth was strong and average hours steady.
All of these are consistent with a marked slowdown in labor supply (due to immigration policy) combined with a continued slight softness in labor demand (as evidenced by the unemployment rate which has been steadily rising at about 0.03 percentage point per month for 2-1/2 years.
But two reasons to be less worried than headline: (1) transitory tariffs & (2) some of this is imputed from rising stock market.
Here are the full set of numbers I'll talk about.
Particularly notable is how much lower market core has been than overall core at every horizon. Note regular core includes imputed items, notably portfolio management fees where the price goes up when the stock market goes up.
Market core is both better predicted by slack and a better predictor of future inflation. It has moved sideways this year. But given that tariffs are (hopefully temporarily) pushing inflation up that suggests that underlying inflation is going down.