Here are the updated valuations after the recent volatility and Q3 earnings. I am looking at the following metrics:
1. EV/GP NTM
2. EV/EBITDA NTM
3. EV/FCF LTM
This is the consolidated graph comparing EV/GP NTM vs estimates of 3-yr revenue growth:
1. EV/GP NTM
2. EV/EBITDA NTM
3. EV/FCF LTM
This is the consolidated graph comparing EV/GP NTM vs estimates of 3-yr revenue growth:

Of the 82 companies analyzed, 62 have positive NTM EBITDA and 49 are FCF LTM profitable.
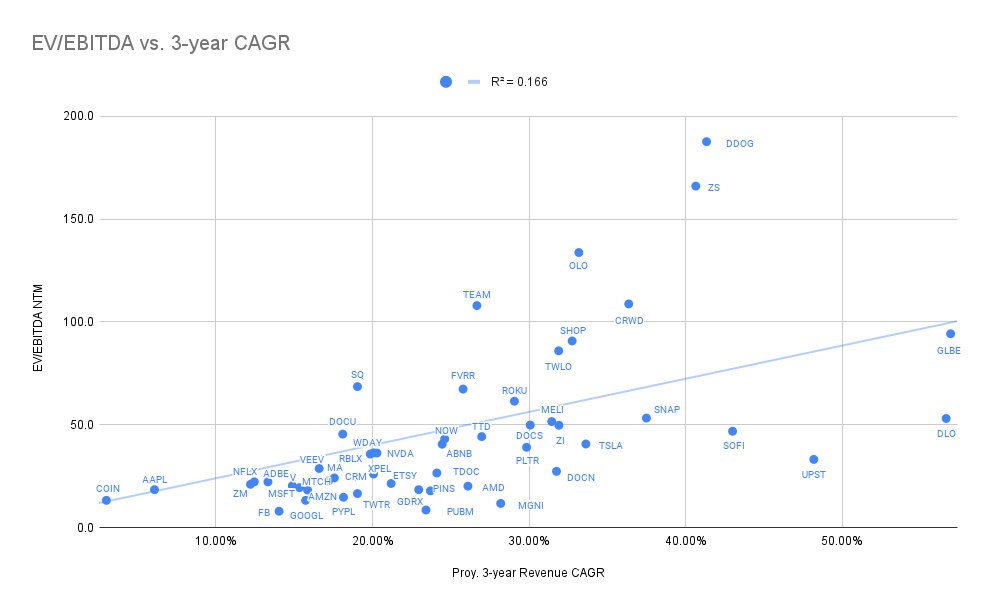
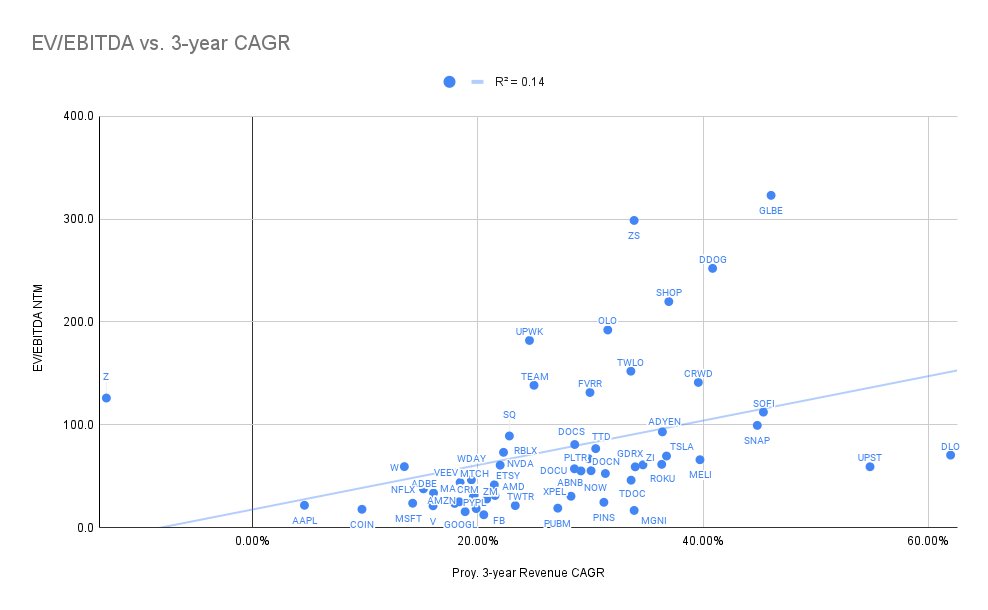
Here is the consolidated graph comparing EV/EBITDA NTM vs estimates of 3-yr revenue growth:
Here is the consolidated graph comparing EV/EBITDA NTM vs estimates of 3-yr revenue growth:
For Free Cash Flow, it is harder to have accurate estimates of future numbers.
So for this metric, I prefer to use the last twelve months (LTM).
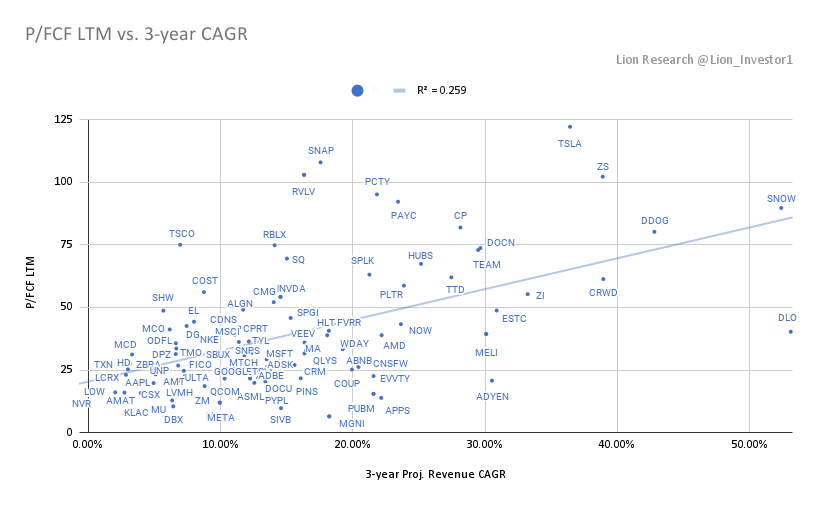
The following is the consolidated graph comparing EV/FCF LTM vs estimates of 3-yr revenue growth:
So for this metric, I prefer to use the last twelve months (LTM).
The following is the consolidated graph comparing EV/FCF LTM vs estimates of 3-yr revenue growth:

By Industry:
E-Commerce
EV/GP NTM and EV/EBITDA NTM
$AMZN 8.1x / 23x
$SE 22.9x
$MELI 14.8x / 66x
$W 6.3x / 59x
$SHOP 57.2x / 220x
$CPNG 10.2x
$ETSY 16x / 41.5x
$OZON 5.1x
$BIGC 13.8x
$GLBE 73x /323x
E-Commerce
EV/GP NTM and EV/EBITDA NTM
$AMZN 8.1x / 23x
$SE 22.9x
$MELI 14.8x / 66x
$W 6.3x / 59x
$SHOP 57.2x / 220x
$CPNG 10.2x
$ETSY 16x / 41.5x
$OZON 5.1x
$BIGC 13.8x
$GLBE 73x /323x

Fintech and Payments
EV/GP NTM and EV/EBITDA NTM
$V 19x / 21x
$MA 23x / 25x
$PYPL 14x / 18x
$SQ 17x / 89x
$AFRM 83x
$SOFI 18x / 112x
$UPST 14x / 59x
$LSPD 17x
$DLO 46.8x / 70x
$MELI 15x / 66x
$COIN 12x / 18x
EV/GP NTM and EV/EBITDA NTM
$V 19x / 21x
$MA 23x / 25x
$PYPL 14x / 18x
$SQ 17x / 89x
$AFRM 83x
$SOFI 18x / 112x
$UPST 14x / 59x
$LSPD 17x
$DLO 46.8x / 70x
$MELI 15x / 66x
$COIN 12x / 18x

Social Media and Ad-tech
EV/GP NTM and EV/EBITDA NTM
$FB 7.6x / 12.4x
$GOOGL 11x / 15x
$PINS 9.2x / 24x
$SNAP 25x / 99x
$TWTR 8x / 21x
$ROKU 15x / 61x
$TTD 36x / 77x
$MTCH 15x / 31x
$MGNI 6.8x / 17x
$PUBM 9x / 19x
EV/GP NTM and EV/EBITDA NTM
$FB 7.6x / 12.4x
$GOOGL 11x / 15x
$PINS 9.2x / 24x
$SNAP 25x / 99x
$TWTR 8x / 21x
$ROKU 15x / 61x
$TTD 36x / 77x
$MTCH 15x / 31x
$MGNI 6.8x / 17x
$PUBM 9x / 19x

Mega Cap
EV/GP NTM and EV/EBITDA NTM
$AAPL 16.6x / 21.6x
$MSFT 17.2x / 23.6x
$GOOGL 11.1x / 15.4x
$AMZN 8.1x / 23.3x
$FB 7.6x / 12.4x
$TSLA 60.4x / 69.5x
$NVDA 37x / 60.6x
$NFLX 19.5x / 37.6x
EV/GP NTM and EV/EBITDA NTM
$AAPL 16.6x / 21.6x
$MSFT 17.2x / 23.6x
$GOOGL 11.1x / 15.4x
$AMZN 8.1x / 23.3x
$FB 7.6x / 12.4x
$TSLA 60.4x / 69.5x
$NVDA 37x / 60.6x
$NFLX 19.5x / 37.6x

SaaS
$ADBE 19x / 33x
$AMPL 40x
$CRM 11x / 29x
$CRWD 31x / 141x
$DCBO 16x
$DDOG 50x / 252x
$DOCN 21x / 52x
$DOCU 14x / 57x
$MDB 44x
$MNDY 32x
$NET 79x
$NTNX 5x
$OKTA 26x
$PLTR 23x / 67x
$SNOW 81x
$TWLO 22x / 152x
$U 39x
$VEEV 23x / 44x
$ZI 30x / 61x
$ZM 15x / 28x
$ZS 49x / 298x
$ADBE 19x / 33x
$AMPL 40x
$CRM 11x / 29x
$CRWD 31x / 141x
$DCBO 16x
$DDOG 50x / 252x
$DOCN 21x / 52x
$DOCU 14x / 57x
$MDB 44x
$MNDY 32x
$NET 79x
$NTNX 5x
$OKTA 26x
$PLTR 23x / 67x
$SNOW 81x
$TWLO 22x / 152x
$U 39x
$VEEV 23x / 44x
$ZI 30x / 61x
$ZM 15x / 28x
$ZS 49x / 298x

Other
EV/GP NTM and EV/EBITDA NTM
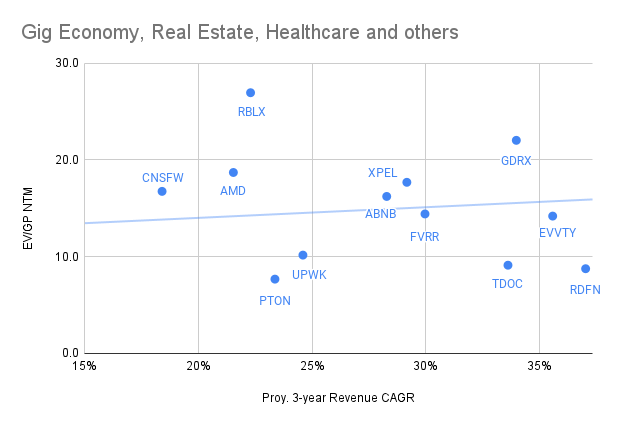
$ABNB 18x / 55x
$AMD 19x / 31x
$CNSFW 17x / 21.5x
$EVVTY 14x / 20x
$FVRR 14x / 131x
$GDRX 22x / 59x
$PTON 8x
$RBLX 27x / 73x
$RDFN 9x
$OPEN 11x / 157x
$TDOC 9x / 46x
$UPWK 10x / 182x
$XPEL 16x / 30x$Z 6.6x / 126x
EV/GP NTM and EV/EBITDA NTM
$ABNB 18x / 55x
$AMD 19x / 31x
$CNSFW 17x / 21.5x
$EVVTY 14x / 20x
$FVRR 14x / 131x
$GDRX 22x / 59x
$PTON 8x
$RBLX 27x / 73x
$RDFN 9x
$OPEN 11x / 157x
$TDOC 9x / 46x
$UPWK 10x / 182x
$XPEL 16x / 30x$Z 6.6x / 126x
Some of the biggest multiple contractions since 23/oct (last post):
$MELI 23x to 15x
$SE 37x to 23x
$DLO 79x to 47x
$LSPD 45x to 17x
$CRWD 49x to 31x
$ASAN 67x to 33x
$MNDY 55x to 32x
$MELI 23x to 15x
$SE 37x to 23x
$DLO 79x to 47x
$LSPD 45x to 17x
$CRWD 49x to 31x
$ASAN 67x to 33x
$MNDY 55x to 32x
$DLO is one of the quickest contractions in multiples I have seen this year.
In just a few months, it went from 116x EV/GP NTM in August, 79x in October and now 47x.
It is the result of a combination of high growth in fundamentals and a 52% drawdown in price from ATH.
In just a few months, it went from 116x EV/GP NTM in August, 79x in October and now 47x.
It is the result of a combination of high growth in fundamentals and a 52% drawdown in price from ATH.
Valuation is just one of many metrics to take into account when investing, but it is useful sometimes to spot opportunities and potential risks.
Particularly now that we are ending the FED's covid QE program.
Particularly now that we are ending the FED's covid QE program.
• • •
Missing some Tweet in this thread? You can try to
force a refresh