Trevor Bedford Profile picture
Dec 4, 2021 19 tweets 7 min read Read on X
As the Omicron epidemic continues to expand in South Africa and as case counts and sequencing data continues to come in, we can better estimate the current transmission rate of Omicron. 1/19
Here, I am focused on two approaches to estimate this transmission rate. One is growth in frequency of Omicron compared to Delta in Gauteng and the other is growth in case counts attributable to Omicron. 2/19
If one variant is fitter than anther variant and is transmitting faster in the population we should expect to see it increase in frequency following logistic growth. See @TWenseleers for discussion of this approach. 3/19
A simple logistic growth fit to sequence data from specimens collected in Gauteng and shared to @GISAID gives a per day growth rate of 0.25 [95% CI 0.15-0.35]. 4/19 Image
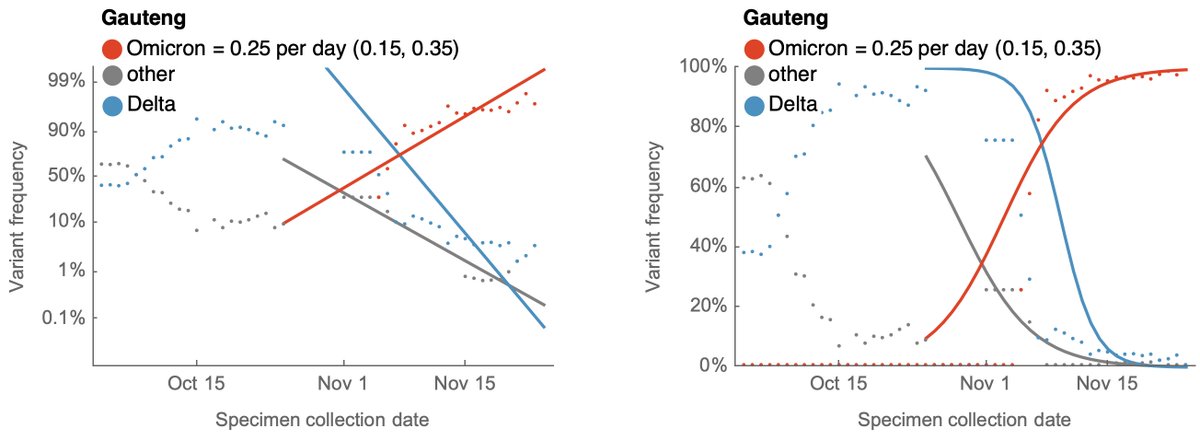
Assuming a generation time for infection-to-infection of 5.1 days, this estimates the relative transmission advantage of Omicron over Delta as exp(growth rate × generation time) = 3.5 [95% CI 2.1-5.9]. 5/19
These estimates are still changing often as genomic data produced by @nhls_sa, @ceri_news and @nicd_sa comes in daily. 6/19
If we look at case counts instead, we can estimate Rt as the number of secondary cases caused by an index case at the current point in time. Higher Rt values indicate more rapid epidemic growth. 7/19
Estimates of overall Rt for Gauteng by @lrossouw has grown from ~0.8 in Oct to between 2.5 and 3 at the end of Nov (unsupervised.online/static/covid-1…). Note there is always a small lag in estimating Rt, as we need to measure backwards from the present. 8/19 Image
We can also use sequence data to partition case counts based on variant frequency. I was doing this previously in the spring as initial Alpha, Beta, Gamma variants spread across the world and later in the summer with Delta. 9/19
If we take a similar approach using sequence data from @GISAID and case count data from @nicd_sa, we get the following picture for South Africa, where rapid increase in Omicron-specific cases is visible in Gauteng. 10/19 Image
Previously, @marlinfiggins ran with this basic logic and built out a Bayesian model to estimate variant-specific Rt through time. 11/19
Applying the same method to sequences and case counts from Gauteng shows Delta Rt remaining around 0.8 through Nov, but Omicron Rt coming in at around ~3.8. 12/19 Image
Just doing a simple ratio of Omicron Rt in Gauteng / Delta Rt in Gauteng gives a ratio of ~4.0. This fits decently with the latest results from logistic growth analysis. 13/19 Image
These are still very early estimates and all this will become more clear as we get comparable estimates from different geographies and with different methods. But ballpark current Rt of Omicron in South Africa of between 3 and 3.5 seems pretty reasonable. 14/19
Note that both logistic growth and Rt estimates depend on assumed generation interval. Here, we've been using 5.1 days, while @TWenseleers is using 4.8 days. This alone will give a slight difference between estimates. 15/19
This estimate of Rt around 3 or 3.5 will become more precise for South Africa in the coming days, but even Rt of 3 is very high. Initial Rt of Delta in South Africa and the US was about 1.5. 16/19
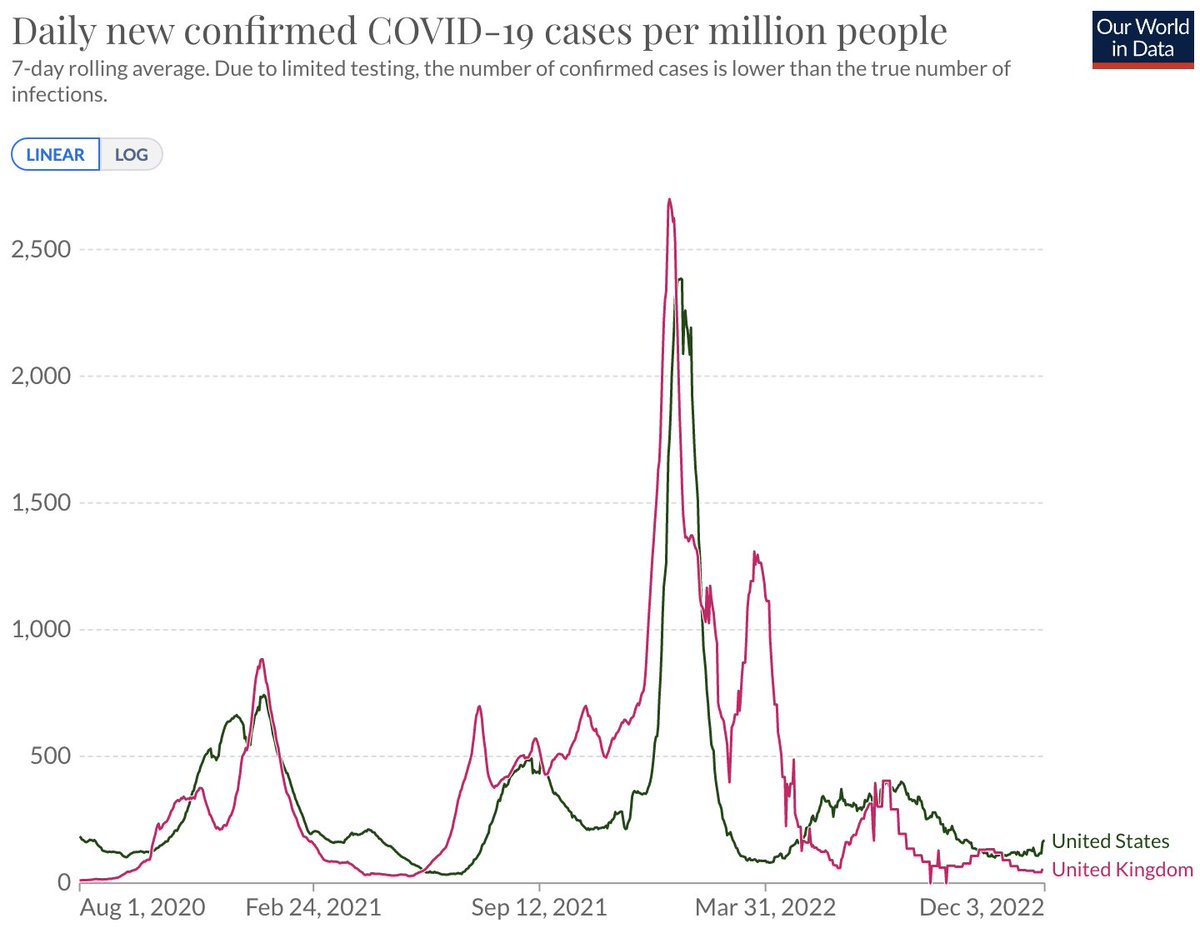
Initial pandemic spread in the US and Europe before mitigation measures went into effect had Rt of about 3.5. 17/19
If Omicron Rt continues at around 3 this indicates a much larger threat in terms of case counts than Delta. I'm hoping that prior immunity protects against severe outcomes, but I'm very concerned about the size of the epidemic wave in the US and across the world. 18/19
The size of this wave will depend largely on the susceptible population. Although current data cannot fully address this, I suspect there is decent immune evasion and some individuals protected from infection by Delta will be susceptible to Omicron. 19/19

• • •

Missing some Tweet in this thread? You can try to force a refresh
 

Keep Current with Trevor Bedford

Trevor Bedford Profile picture

Stay in touch and get notified when new unrolls are available from this author!

Read all threads

This Thread may be Removed Anytime!

PDF

Twitter may remove this content at anytime! Save it as PDF for later use!

Try unrolling a thread yourself!

how to unroll video
  1. Follow @ThreadReaderApp to mention us!

  2. From a Twitter thread mention us with a keyword "unroll"
@threadreaderapp unroll

Practice here first or read more on our help page!

More from @trvrb

Dec 5, 2022
Currently, the US is reporting about 54k daily cases of COVID-19 (16 per 100k per capita) and the UK is reporting about 4k (6 per 100k). This seems comfortingly low compared to even this summer's BA.5 wave and let alone last winter's BA.1 wave. Figure from @OurWorldInData. 1/16
However, at this point, nearly all infections will be in individuals with prior immunity from vaccination or infection and this combined with a roll back in testing makes it unclear how to interpret current case counts compared to previous time periods. 2/16
We're interested in the case detection rate or the ratio of underlying new infections compared to reported cases. Throughout much of 2020 and 2021, I had a working estimate of 1 infection in ~3.5 getting reported as a case. 3/16
Read 16 tweets
Aug 16, 2022
Largely through partial immune escape, lineage BA.5 viruses resulted in sizable epidemics throughout much of the world. However, in most countries these epidemics are now beginning to wind down. What do we expect after BA.5? 1/10
Lineage BA.2.75 (aka 'Centaurus') has been high on watch lists due to sustained increase in frequency in India combined with the presence of multiple mutations to spike protein. We now have enough sampled BA.2.75 viruses from outside India to make some initial conclusions. 2/10
If we look at frequency data we see sustained logistic growth of BA.2.75 in India, Japan, Singapore and the US. Critically, in India it is clearly displacing BA.5. 3/10
Read 10 tweets
Aug 3, 2022
Based on the experience in winter 2020/2021, seasonal influence on SARS-CoV-2 transmission is quite clear, but much of the Northern Hemisphere is currently experiencing large summer epidemics driven the spread of evolved BA.5 viruses. 1/11
It's necessarily fraught to try to make predictions of seasonal circulation patterns going forwards, but we can gain some intuition from simple epidemiological models. 2/11
In particular, we can use an SIRS system in which individuals go from Susceptible to Infected to Recovered, and then return to the Susceptible class due to immune waning / antigenic drift of the virus. 3/11
Read 12 tweets
Jul 20, 2022
There seems to be a worry that telling people we've exited the "pandemic phase" will lead to further reduced precautions. As always however, I think it's best not to conduct messaging for intended behavioral effect and just try to make scientifically accurate statements. 1/5
Given vaccination and infection, the US and global population now has widespread immunity to SARS-CoV-2 and deaths per-infection are about 10 times lower than they were pre-immunity in 2020 with a ballpark IFR of 0.05% (though this will vary by immunity and age demographics). 2/5
You can see this reduction in mortality rate in looking at projections of deaths from lagged-cases keyed to early case fatality rate. 3/5
Read 5 tweets
Jun 27, 2022
The @US_FDA VRBPAC committee will be meeting tomorrow to discuss variant-specific COVID-19 vaccines (fda.gov/advisory-commi…). Based on present observations, I would argue that the most important metric to optimize are titers against BA.4/BA.5 viruses. 1/10
We've seen repeated replacement of SARS-CoV-2 variants during 2022, first of Delta by Omicron BA.1 and then by sub-lineages of Omicron, with BA.2 replacing BA.1 and now with BA.4/BA.5 replacing BA.2. 2/10
Viruses have been evolving to be higher fitness through both increases in intrinsic transmissibility (seen in BA.2 vs BA.1) as well as escape from existing population immunity (seen in Omicron vs Delta as well as BA.4/BA.5 vs BA.2). 3/10
Read 10 tweets
Jun 3, 2022
Global monkeypox confirmed and suspected cases compiled by @globaldothealth show initial rapid increase as case-based surveillance comes online, followed by slower continued growth. 1/10
This is data from github.com/globaldothealt… and has had a 7-day smoothing applied and all y-axes are shown on a log scale. 2/10
If we focus on the last 11 days, we can see steady exponential growth in global cases with a ~7.7 day doubling. 3/10
Read 11 tweets

Did Thread Reader help you today?

Support us! We are indie developers!


This site is made by just two indie developers on a laptop doing marketing, support and development! Read more about the story.

Become a Premium Member ($3/month or $30/year) and get exclusive features!

Become Premium

Don't want to be a Premium member but still want to support us?

Make a small donation by buying us coffee ($5) or help with server cost ($10)

Donate via Paypal

Or Donate anonymously using crypto!

Ethereum

0xfe58350B80634f60Fa6Dc149a72b4DFbc17D341E copy

Bitcoin

3ATGMxNzCUFzxpMCHL5sWSt4DVtS8UqXpi copy

Thank you for your support!

Follow Us!

:(