Okay folks, time for a South Africa update, focused this time on severity of disease.
First up, the report from hospitals in Tshwane (the district furthest along in Omicron wave) is essential reading, as is thread from @miamalan samrc.ac.za/news/tshwane-d…
First up, the report from hospitals in Tshwane (the district furthest along in Omicron wave) is essential reading, as is thread from @miamalan samrc.ac.za/news/tshwane-d…
https://twitter.com/miamalan/status/1467172016918773775
If/when you’ve read those, you’ll understand why I didn’t open this thread with the charts showing exponential rise in cases, test positivity & admissions, which I believe risk oversimplifying the much more nuanced picture set out in the Tshwane report.
The charts I’m now going to show are a direct response to the Tshwane report. I don’t believe any of these contradict what the report discusses, but I think they help to contextualise it and think about where things are headed.
First up, the question of severity of hospital cases:
• Data from @nicd_sa for the whole of Gauteng province echo the report’s finding for Tshwane: to date, a much lower share of Covid-positive patients in this wave require ICU than at same stage of Delta wave
• Data from @nicd_sa for the whole of Gauteng province echo the report’s finding for Tshwane: to date, a much lower share of Covid-positive patients in this wave require ICU than at same stage of Delta wave

• For patients on oxygen, the share now appears roughly the same as with Delta. Tshwane report found that 70% of patients on oxy were due to Covid. We don’t have that breakdown for Delta oxy patients, but can probably assume "oxy because Covid" share is slightly down for Omicron
Okay, so share of Covid+ patients with severe Covid is lower for Omicron than for Delta. That’s good news!
But let’s dig deeper:
First, let’s move from shares to totals. Number of patients on oxy — and esp ICU — are much lower than at same stage of Delta, but both are climbing.
But let’s dig deeper:
First, let’s move from shares to totals. Number of patients on oxy — and esp ICU — are much lower than at same stage of Delta, but both are climbing.

If we switch to a log scale, we can better compare the growth rates:
On current trends, patients on oxy (mostly due to Covid) will soon pass Delta trajectory, and numbers in ICU are also heading up fast (obv be wary of extrapolating ICU trend, where data/reporting is bumpy)
On current trends, patients on oxy (mostly due to Covid) will soon pass Delta trajectory, and numbers in ICU are also heading up fast (obv be wary of extrapolating ICU trend, where data/reporting is bumpy)

One critical thing to note at this stage — as highlighted in the Tshwane report — is the markedly different age profiles of the two waves:
Over first two weeks of each wave, Omicron cases and hospitalisations skew *much* younger. That alone would be expected to reduce ICU share.
Over first two weeks of each wave, Omicron cases and hospitalisations skew *much* younger. That alone would be expected to reduce ICU share.

As @tomtom_m shows in his regular demographic updates, cases in Gauteng are now spreading into older age-groups (upper right chart here), and that will feed into admissions/patients, shifting the risk profile
https://twitter.com/tomtom_m/status/1466121405322260482
So the drop in ICU share from 25% to 8% may turn out to be artificially steep, but I don’t think one can read the Tshwane report and all other info coming from SA and conclude that the ICU share of patients in this wave will be as high as it was in prior waves. Again, good news!
So what does this all mean?
First up, does it mean Omicron is "more mild" than previous variants?
Well, far more likely it means that people who’ve been vaccinated or infected are showing solid protection against severe disease. And this should not be a surprise!
First up, does it mean Omicron is "more mild" than previous variants?
Well, far more likely it means that people who’ve been vaccinated or infected are showing solid protection against severe disease. And this should not be a surprise!
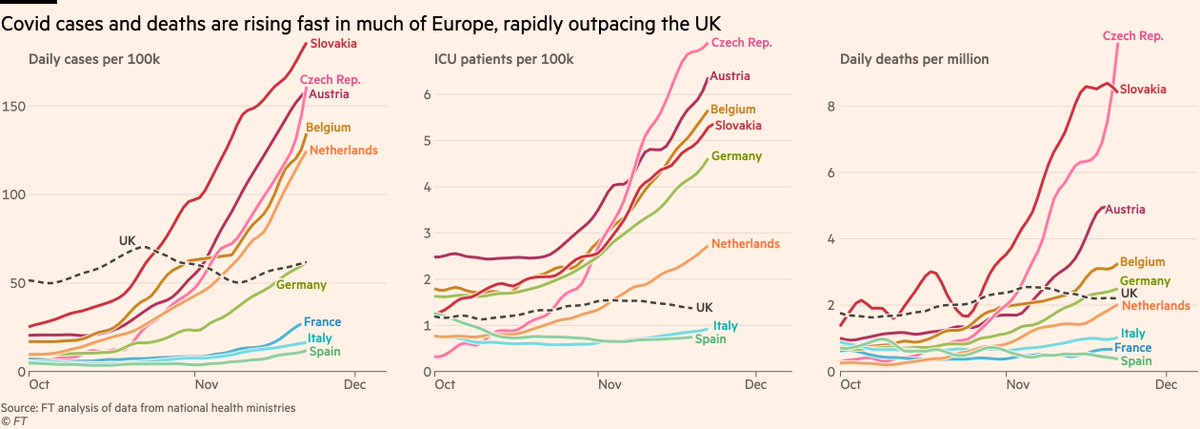
All summer and autumn in Europe we’ve seen how immunity greatly reduces the share of cases that becoming hospitalised, and the share of admissions that become deaths
https://twitter.com/jburnmurdoch/status/1458748635609550848
So is Omicron inherently a more mild strain? No evidence either for or against that at this stage.
But is it more mild for people with immunity from either recent vaccination or infection? Yes! Vast majority of people in Gauteng have either been vaxxed or infected.
But is it more mild for people with immunity from either recent vaccination or infection? Yes! Vast majority of people in Gauteng have either been vaxxed or infected.
Ever since day one of the pandemic, immunologists have stressed that while protection against *infection* can indeed be quite vulnerable to mutated variants, protection against severe disease should hold up much better.
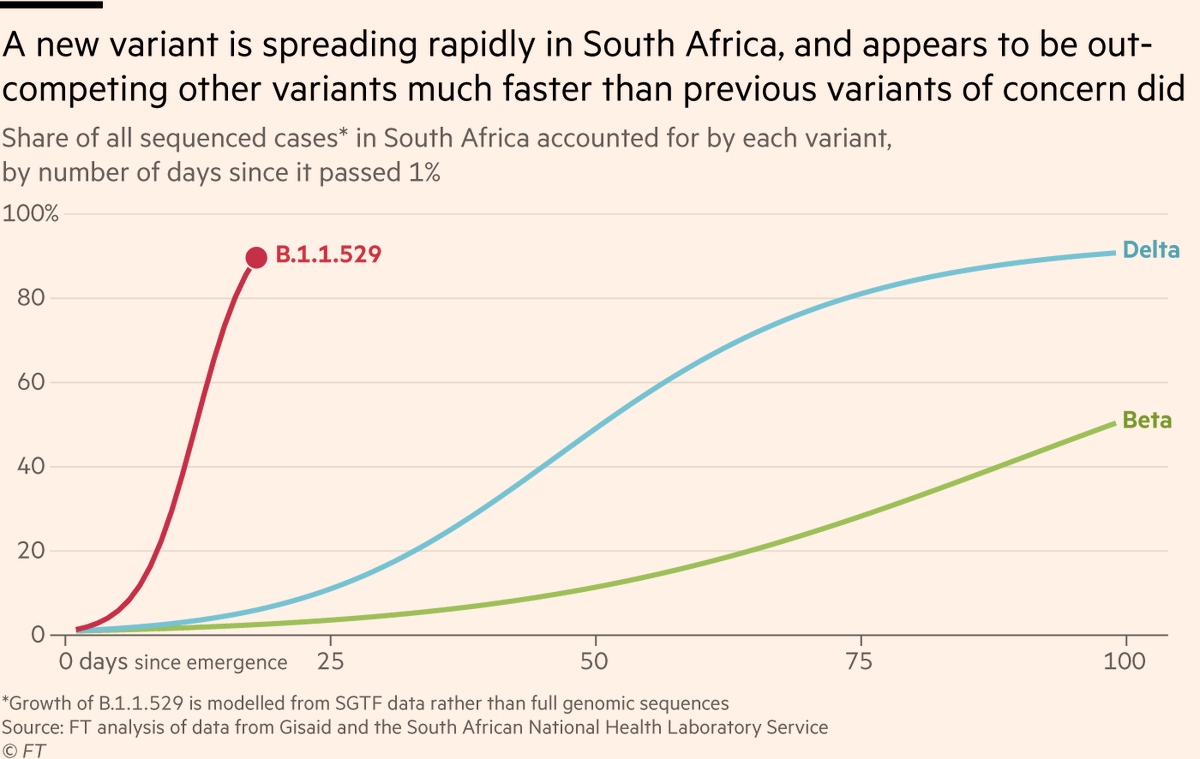
BUT: now that I’ve injected a triple-dose of nuance, here’s your exponential case chart:
Even if far less than 25% of patients require ICU this time, a small share of a rapidly increasing number can still become a big number. And numbers are going up very, very fast.
Even if far less than 25% of patients require ICU this time, a small share of a rapidly increasing number can still become a big number. And numbers are going up very, very fast.

And this is why Omicron remains worth taking very, very seriously in South Africa, in Europe, in the US and elsewhere.
With governments very reluctant to reimpose major restrictions, Omicron’s growth advantage (whether conferred by shorter incubation period, immune evasion and or something else) is bound to produce very rapid waves of infections when it takes hold
https://twitter.com/KateEMcCann/status/1467217746249363461
So if we take the equation:
ICU beds filled = people infected x risk of needing ICU
"People infected" could get very big, very quickly, even with lots of vax and prior infection.
So race is now on to use third doses to get "risk of requiring ICU" as small as possible 💉💉💉
ICU beds filled = people infected x risk of needing ICU
"People infected" could get very big, very quickly, even with lots of vax and prior infection.
So race is now on to use third doses to get "risk of requiring ICU" as small as possible 💉💉💉
Some further reading:
• Here’s our story on the race to resolve the uncertainties around Omicron ft.com/content/e742a4…
• And @mugecevik has a typically fantastic thread setting out exactly what those uncertainties are, and the science around them
• Here’s our story on the race to resolve the uncertainties around Omicron ft.com/content/e742a4…
• And @mugecevik has a typically fantastic thread setting out exactly what those uncertainties are, and the science around them
https://twitter.com/mugecevik/status/1466845357686640640
And a belated addendum:
Both the Tshwane report and @miamalan’s thread demonstrate how vital local knowledge continues to be to our understanding of Omicron. The amount of work being done in South Africa to discover and communicate key insights for the world is truly amazing.
Both the Tshwane report and @miamalan’s thread demonstrate how vital local knowledge continues to be to our understanding of Omicron. The amount of work being done in South Africa to discover and communicate key insights for the world is truly amazing.
• • •
Missing some Tweet in this thread? You can try to
force a refresh