Scotland: Cardiac data
Below the latest trend of cardiac attendances by Scottish Ambulance Service - this is *excess* above the 2018/19 norm.
Huge spike in summer, 500 ambulance calls per week above normal, mainly age 15-64. Was settling, then spike up again since late October.
Second is the ‘Out of hours’ cardiac calls. This is when someone’s GP is closed, but they need to call a doctor about heart problem - it goes to the out of hours service.
The 2018-19 trend is purple, and we have a huge excess in the 15-44 age group calling about cardiac issues
From the data we can clearly see *this is not normal” due to such excess, but we need to internalise that message? This. Is. Not. Normal. We should not see so many people - especially young people - encountering such issues synchonously en-masse.
• • •
Missing some Tweet in this thread? You can try to
force a refresh
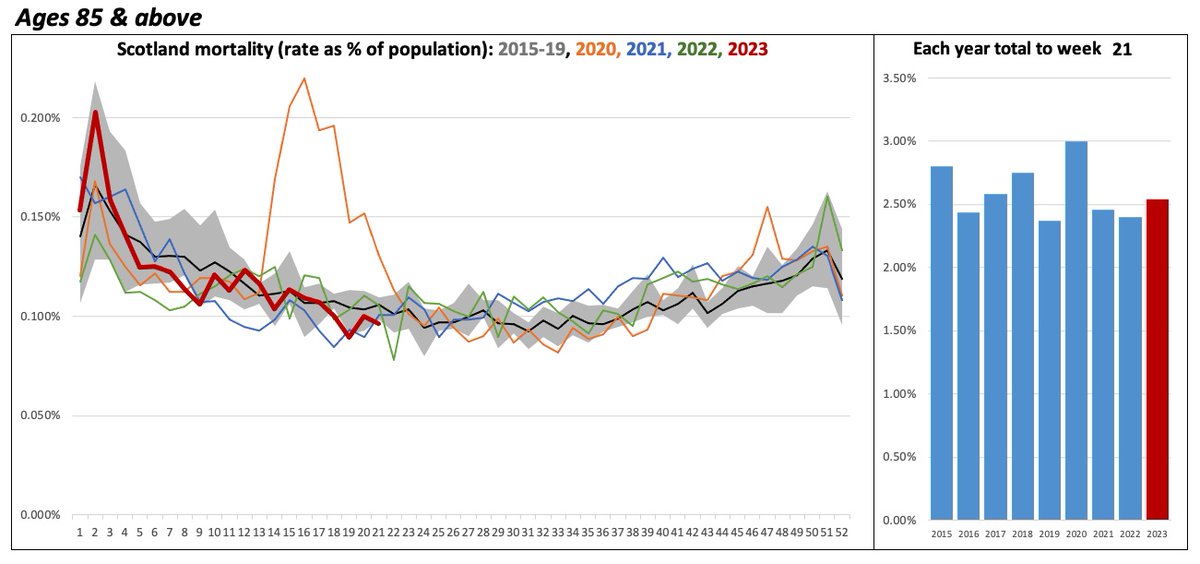
Accounting for demographic changes (increased number of elderly, higher average age in each group), Scotland’s mortality in 2023 looks much as we would expect.
Started with a high January (“flu”) than affected older age groups, and now coming down.
85+ quite a normal year
Ages 75-84 were most hit by flu, beyond even the high of 2018. Thus showing as a high year initially, then below average but since has been running the high end of normal range.
A bit elevated, but not especially so.
Ages 65 to 74.
It’s too tricky to calculate the average age in this group (we don’t have death data by individual year), but suspect the average age is going up, hence the trend here has been gently up since 2015. That said this is a slightly high year, driven by January.
Scotland excess mortality through April 2023
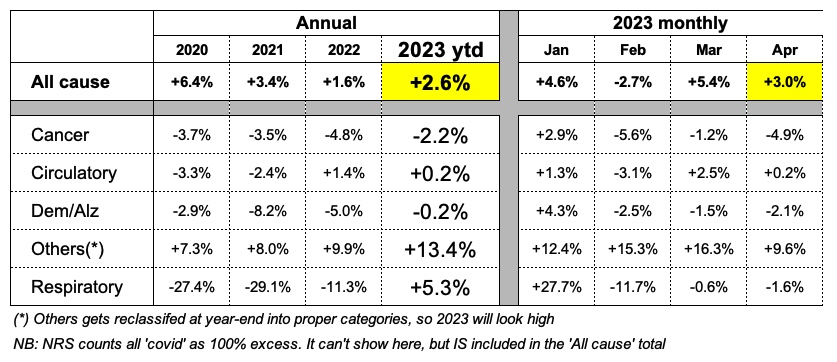
Accounting for population size & age by use of ASMR, excess mortality in Scotland is +2.6% year-to-date, a bit lower than 2021, a bit higher than 2022.
What’s more thought provoking is when we step back from numbers to see the trends.
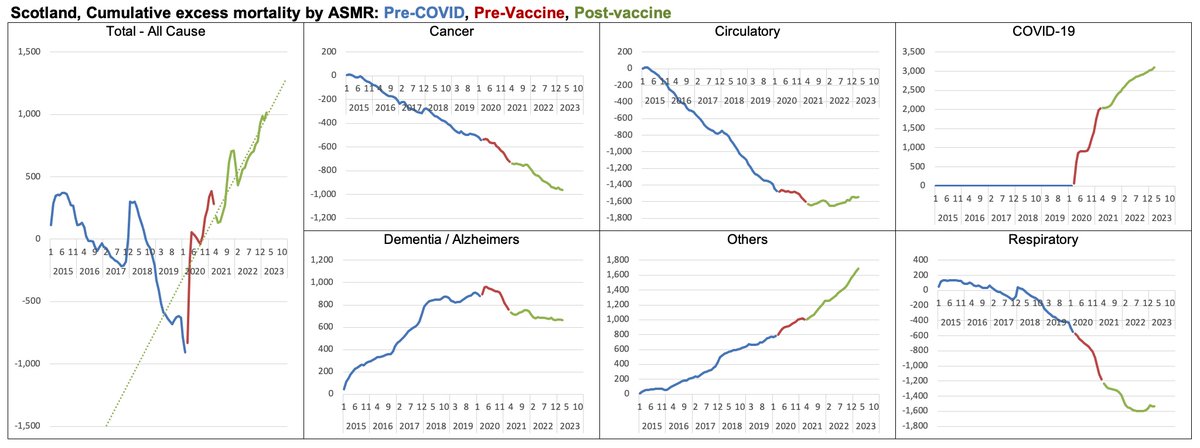
First, by cause.
Mortality was falling in Scotland, but note that abruptly changed with the pandemic & NO recovery since. The angle of increase hasn't slowed
Cancer trend remains improving, circulatory much worse than it was. Dem/Alz looks like misattribution, & C19 cured flu🙄
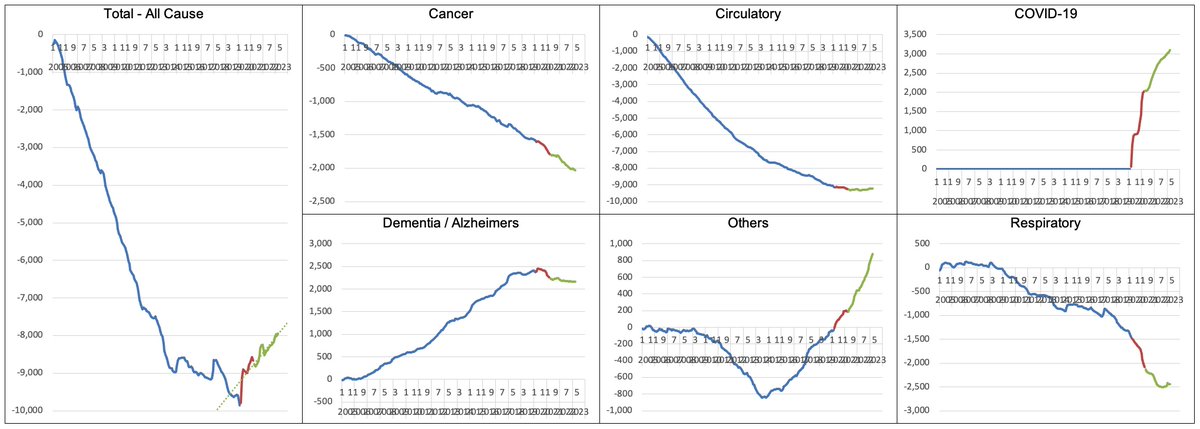
This is perhaps clearer when we zoom out and see longer term.
See how much mortality was improving, & that has radically changed. Gov are still attributing basically all excess to COVID + Others.
So what did the miracle 💉achieve if excess is unchanged, and C19 is the excess?
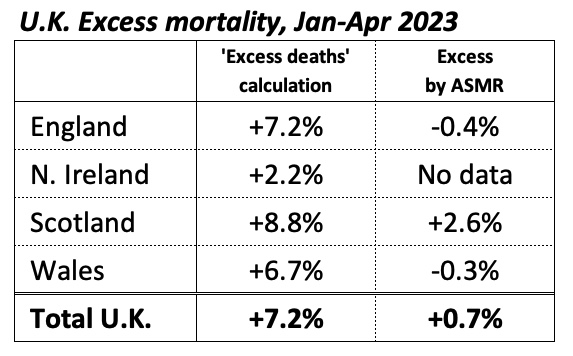
All UK nations updated their monthly excess mortality through April. For 2023 to date we see;
1) Scotland (+2.6%)
2) Wales (-0.3%)
3) England (-0.4%)
No ASMR data for N.I.
Overall UK total: +0.7%
‘Excess deaths’ shows hugely different, much higher. Why?
The chart shows monthly excess by ‘excess deaths’ and by ‘ASMR”. We see ‘excess deaths has ALWAYS measured higher than ASMR - this is not new.
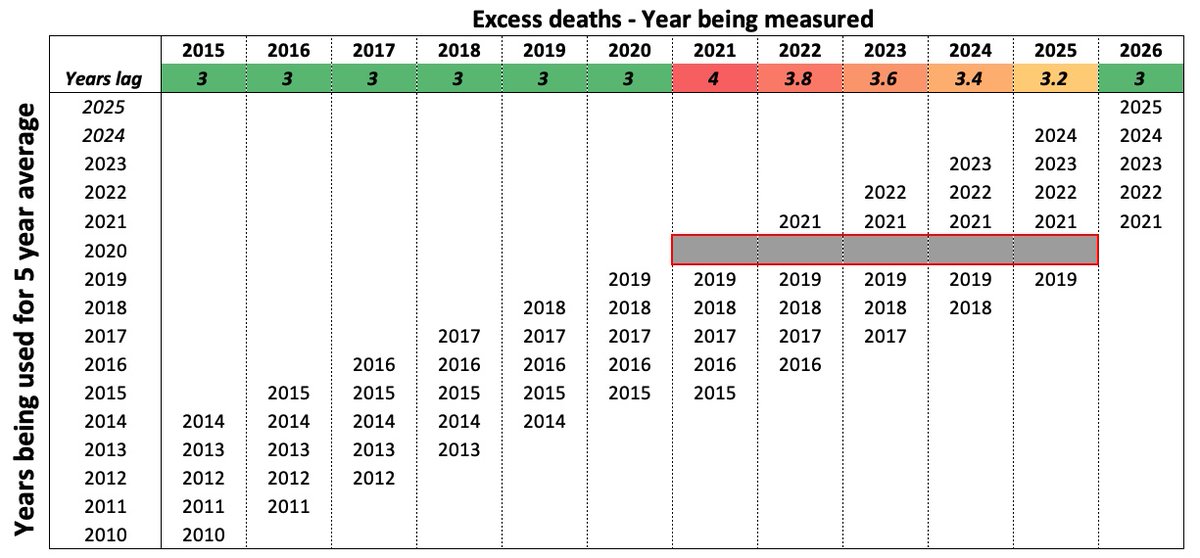
The reason is that ASMR measures against the CURRENT population, and ‘excess deaths’ measures against the population 3 years ago.
What IS new is that we are now measuring ‘excess deaths’ against a population not THREE years ago, but almost four years ago.
This is entirely new, and makes ‘excess deaths' even higher. It’s caused by 2020 being dropped from the calculation
This will come back to normal in 2026.
"Beep, beep, beep..."
That's the sound of the reversing alarm, as the narrative is thrown into reverse - "They were never described as preventing transmission". (Actually they were, yet clearly they didn't - as we see from 'cases' data (PCR+) in Scotland. 👇
"But still, robust protection against hospitalisation..."
Er..... in that case Scotland's actual experience on COVID hospitalisations are impossible to explain.
🤔
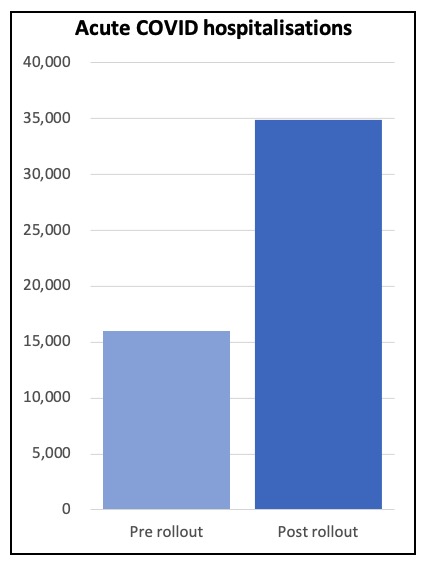
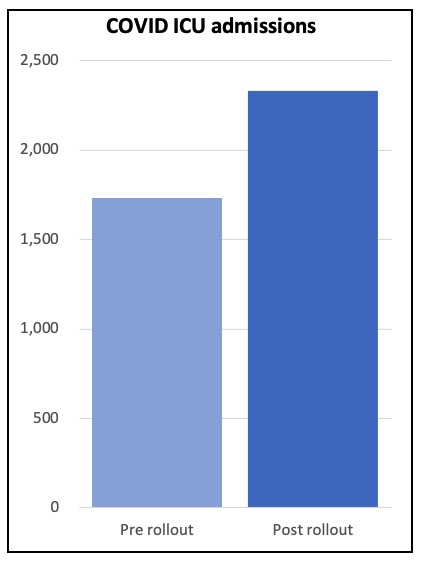
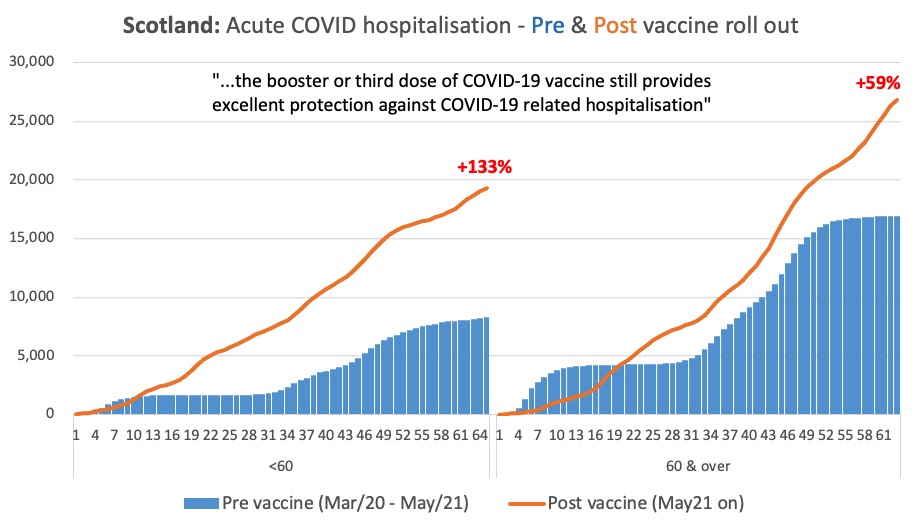
We've now had equal periods without vaccines (Mar20 until rollout complete in May21) and without vaccines (May21 until now), 63 weeks of each.
We see that despite assurances, ‘acute COVID hospitalisations’ post #sacredcows are 59% higher in the 60+, and 133% higher in under 60s
What we see is;
- More people hospitalised, both <60 (19,000 versus 8,000) and in the'vulnerable' 60 and above (27,000 versus 17,000)
- NO more 'flat' periods where there are no admissions, the rate of admissions is faster than before, and incessant, no breaks
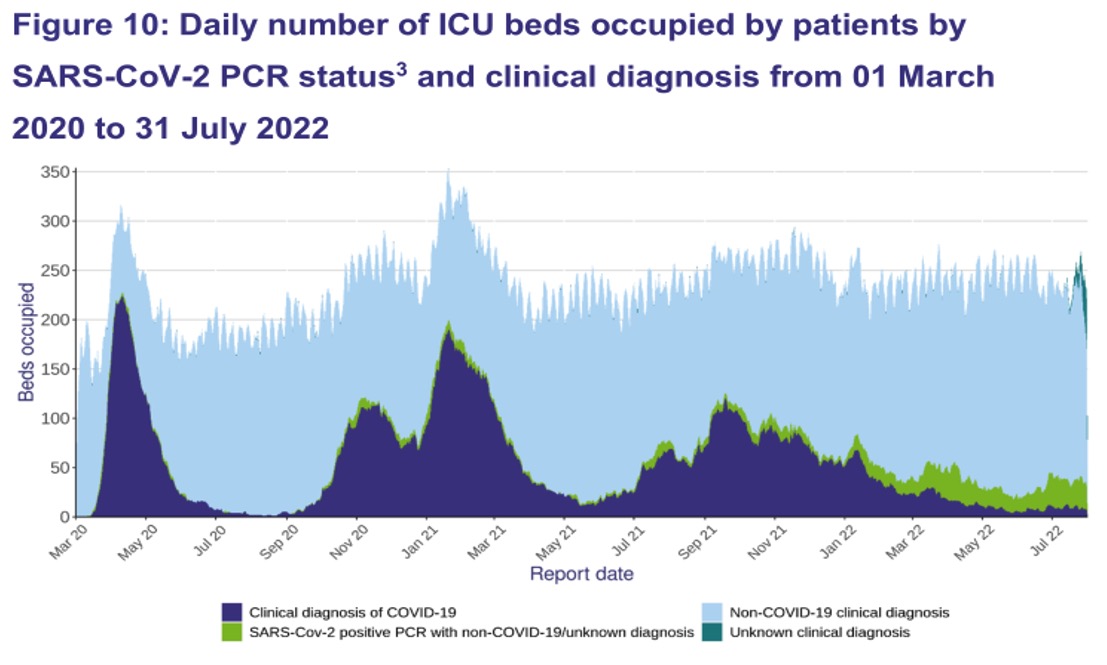
So too ICU - PHS now note "If people test COVID-19 positive on admission to hospital, it may not be the primary reason for admission, and instead an incidental finding"
No 💩 Sherlock, been saying that forever. Look at winter 2020 - 50% of ICU was “Non-COVID19 clinical diagnosis"
Scotland hospital status updated. 1. Do you need an op?
Upper endoscopy waitlist slightly down, but all other endoscopy waiting lists sharply up, and all imaging waitlists (e.g. CT, MRI) hugely up - ultrasound waitlist nearly doubled.
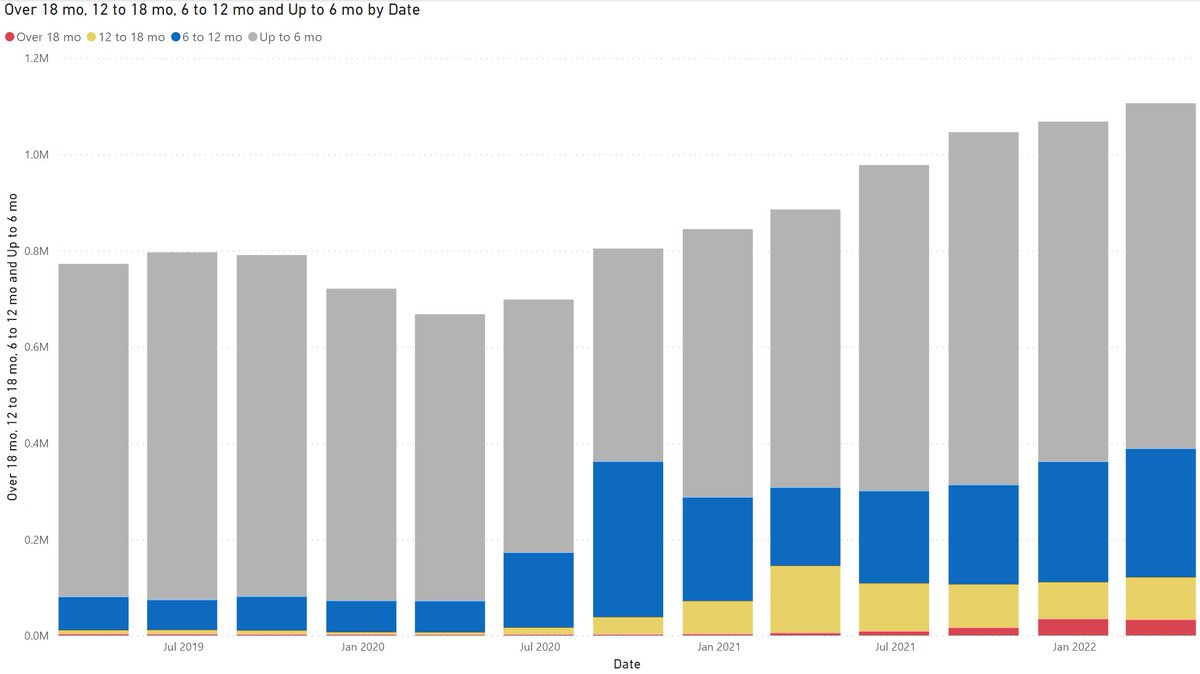
2. You need an op - how is the waitlist?
Chart shows number on the waiting list, and how long they have been waiting. Total continually rising, as well as the proportion waiting 6 months, 12 months, or longer.
3. How are we tackling that list?
This shows the number of operations carried out, in total and by month.
The number has been basically steady since early 2021, not recovering toward prior levels. Running around 33% lower than the pre-COVID levels.