Lucas Chancel Profile picture
Dec 7, 2021 15 tweets 6 min read Read on X
So glad to release the World #InequalityReport 2022 today! It's been quite an adventure working on it, in the midst of a pandemics. The report comes with a wealth of data & its own website: wir2022.wid.world -check it out! If you're in a rush, here's what you need to know⬇️
A word on the pandemics: it has exacerbated global inequalities at the top and the bottom. Billionaires’ wealth rose by more than €3.6 trillion during the pandemics while more than 100 million people are in extreme poverty because of the crisis.
In 2021, we find that the global top 10% captures 52% of global income, while the poorest half captures only 8.5% of the total. Wealth is much more concentrated than income: the top 10% captures 76% of all wealth and the global bottom 50%, just 2% of it (see the video).
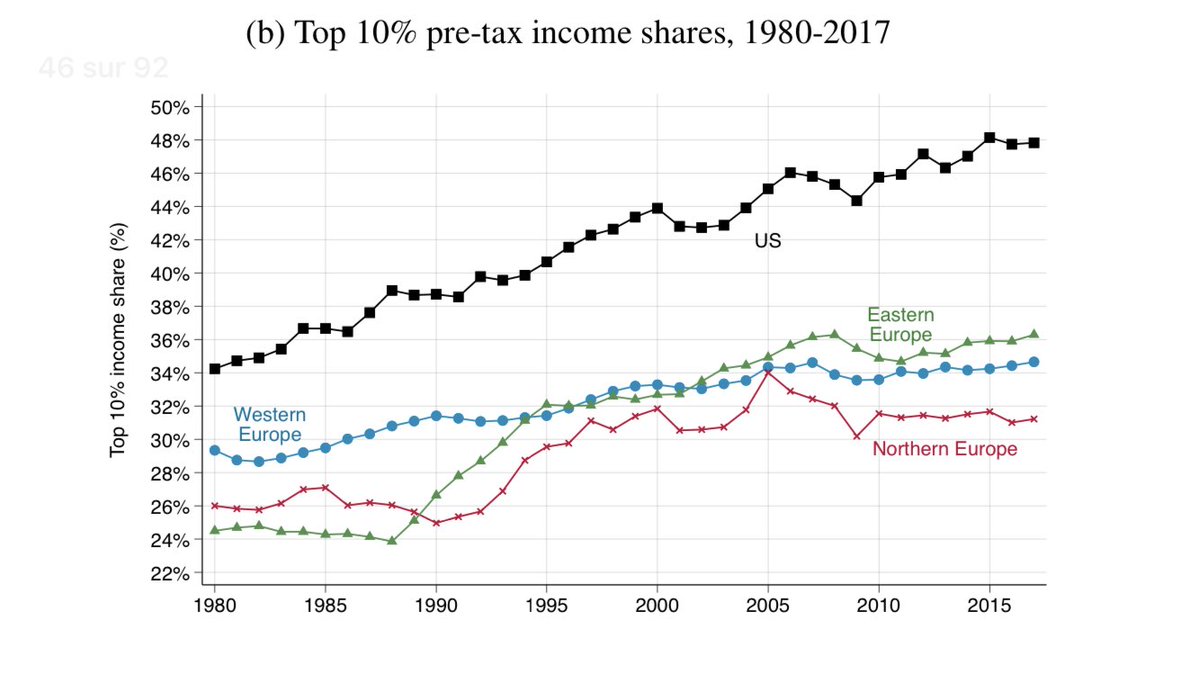
We observe a diversity of inequality regimes across the world. The top 10% income share varies between 35% (Europe) and 60% (MENA, S. S. Africa). The poorest half of the population earns 15-20% of incomes (Europe, East Asia) vs. less than 5-10% in the most unequal regions.
Most of the differences in income inequality levels measured after taxes can be explained by differences in inequality before taxes. This highlights the key role of social policies to tackle inequality (i.e. access to public services like health, education or labor regulations)
Indeed, social services need to be financed. Countries with low levels of inequality before taxes have large social states financed by taxes which represent 30-50% of GDP. In developing countries, taxes represent 5-20% of GDP. More on taxes below.
Here’s a striking & new result: while some countries do better than others to contain income inequality, all countries are very bad at limiting wealth inequality. Look for yourself: the bottom 50% wealth share is always below 5%. Half of the population almost doesn't own anything
At the global level, wealth creation has been very unequal over the past 25 years. The top 1% captured 38% of total wealth growth, the bottom 50% just 2% of it. The graph shows avg. annual growth rates across the world population. Growth rates were v. high for the v. wealthy.
The good news is that there is no fatality to inequality. The graph below shows that Europe & the US were able to reduce top 1% shares over the 20th century, thanks to policies & not just wars. A lot has been done... & there is still a lot to do (especially on wealth inequality)
From a historical perspective, *global* inequality remains as high today as at the peak of Western imperialism in the early 20th century. In other words, we still haven't fully exited the extremely unequal economic hierarchies created then.
The key novelty is the return of inequality within countries. While inequality between countries remain very large (think about the US vs. India), inequality within countries are even larger today (see graph below): there are super rich Indians and poor Americans...
New dimension of the report: global gender inequality. @asrobilliard & @ThereFeen show that women earn just 35% of labor incomes worldwide. Men make the remaining 65%. Parity means reaching 50% and, at current rates, it takes the world about a hundred years to get there.
Another new dimension: global carbon inequality. Climate change intensifies global inequalities between rich & poor nations & between rich & poor individuals within countries. In the report, we also document very large inequalities in contribution to climate change (see below).
There are indeed high emitters in poor countries, and low emitters in rich countries. We stress that accelerating the energy transition will be hard without significant redistribution of income & wealth from high polluters to low polluters within countries (and globally...).
Many more insights at wir2022.wid.world. Check it out - and if you like it, share it !

• • •

Missing some Tweet in this thread? You can try to force a refresh
 

Keep Current with Lucas Chancel

Lucas Chancel Profile picture

Stay in touch and get notified when new unrolls are available from this author!

Read all threads

This Thread may be Removed Anytime!

PDF

Twitter may remove this content at anytime! Save it as PDF for later use!

Try unrolling a thread yourself!

how to unroll video
  1. Follow @ThreadReaderApp to mention us!

  2. From a Twitter thread mention us with a keyword "unroll"
@threadreaderapp unroll

Practice here first or read more on our help page!

More from @lucas_chancel

Sep 29, 2022
Excited to release this paper in @nature sustainability today!
Study: nature.com/articles/s4189…
Pre-print : lucaschancel.com/global-carbon-…
A few key results : [1] The top 10% of the world population is responsible for close to half of world emissions. [2] The bulk of global inequality in individual carbon emissions is now due to within-country differences. This was not the case in 1990.
[3] Emissions at the very top of the distribution matter: the global top 1% make 17% of world emissions. In this study, we find that emissions at the very top predominantly come from investments rather than from their consumption. (See below what we mean by investment emissions.)
Read 7 tweets
Oct 12, 2021
Au-delà des discours sur le plan #France2030, regardons les faits. En 2022, la baisse de la dépense publique par étudiant va se poursuivre. L'enseignement supérieur a de moins en moins de moyens. On parle d'investissements d'avenir: en réalité, la jeunesse est sacrifiée. 👇
Dans le Projet de Lois des Finances 2022, on note une hausse du budget de l'ens. supérieur, de 0.2Mds € (de 14Mds € en 2021 à 14.2Mds€ en 2022). Une hausse de 1.4%. Mais l’inflation prévue sur la même période est de... 1.4%. Il n'y a donc pas de hausse des moyens réels.
Ce n’est pas tout: le nombre d’étudiants augmente chaque année. Entre 2021 et 2022, la hausse prévue est de 1.2%. Les moyens stagnent mais les effectifs augmentent. Résultat: une baisse de 1.2% des moyens par étudiant en un an.
Read 5 tweets
Oct 3, 2021
Les #PandoraPapers démontrent à nouveau l'étendue de l'injustice du système fiscal européen & international. Thread 👇
La révolution néolibérale des années 1980-1990, c'est une série de choix politiques qui a créé deux catégories de contribuables: les captifs (vous et moi) et les mobiles (ceux qui peuvent échapper à l'impôt via les paradis fiscaux).
Il n'est pas anecdotique de retrouver ds les #PandoraPapers des noms associés à des tenants du courant social-libéral, qui a accompagné & amplifié ces politiques. Les constructeurs du système sont eux-même devenus des contribuables mobiles et on pu évader leurs impôts.
Read 7 tweets
May 10, 2021
Dans sa chronique, S. Lauer de @lemondefr affirme que la 'Bidenmania' serait une illusion. Pourquoi? Parce que Biden s'alignerait sur les standards Européens et Français. En matière d'impôt sur les sociétés, cette lecture est fausse. Explications (1/5)
lemonde.fr/idees/article/…
Selon Lauer, le taux de 28% d'impôt sur les sociétés (IS) proposé par Biden mettrait à niveau les taux US et Français, pas de quoi s'émerveiller donc. C'est d'abord faux à 1ère vue: le taux d'IS en France est de 26.5% et baissera à 25% en 2022. Mais c'est surtout oublier... (2/5)
...qu'aux 🇺🇸, l'impôt est la somme du taux fédéral et de celui des Etats. En Californie par exemple (40 millions d'habitants) le taux d'IS local est de 9%. Les entreprises y payeraient donc 28+9=37%, nettement au-dessus du taux Français et de la moyenne en Europe (à 25%) (3/5)
Read 5 tweets
Oct 10, 2020
«Why is Europe More Equal Than the US?»

New work with @thomas_blncht & @amorygethin 🚨

We show that European countries and Europe as a whole are more equal than the US

The question is: why?

We take a fresh look at this 👇🏼

1/4
2/4 According to the standard view, EU countries *redistribute* more than the US and that’s why Europe is more equal

In fact, this isn’t quite right

As you can see in the graph below, low income groups (in black) don’t get more from redistribution in Europe than in the US👇🏼
3/4

In fact, the poor & the middle class in the EU are relatively richer than in the US, *before* receiving social transfers

👉🏼 the EU is more equal mainly thanks to «predistribution» (the mechanisms that determine your income before taxes/transfers) and not «redistribution»
Read 4 tweets
Oct 15, 2019
Seven key takeaways from the absolute must read "The Triumph of Injustice" by Emmanuel Saez & @gabriel_zucman.

#1 The US has become a gigantic flat tax
#2 For the first time on record in the US, billionaires pay less taxes than the working class.
#3 The decline of progressive taxation story is decline is corporate & property taxation story.
Read 7 tweets

Did Thread Reader help you today?

Support us! We are indie developers!


This site is made by just two indie developers on a laptop doing marketing, support and development! Read more about the story.

Become a Premium Member ($3/month or $30/year) and get exclusive features!

Become Premium

Don't want to be a Premium member but still want to support us?

Make a small donation by buying us coffee ($5) or help with server cost ($10)

Donate via Paypal

Or Donate anonymously using crypto!

Ethereum

0xfe58350B80634f60Fa6Dc149a72b4DFbc17D341E copy

Bitcoin

3ATGMxNzCUFzxpMCHL5sWSt4DVtS8UqXpi copy

Thank you for your support!

Follow Us!

:(