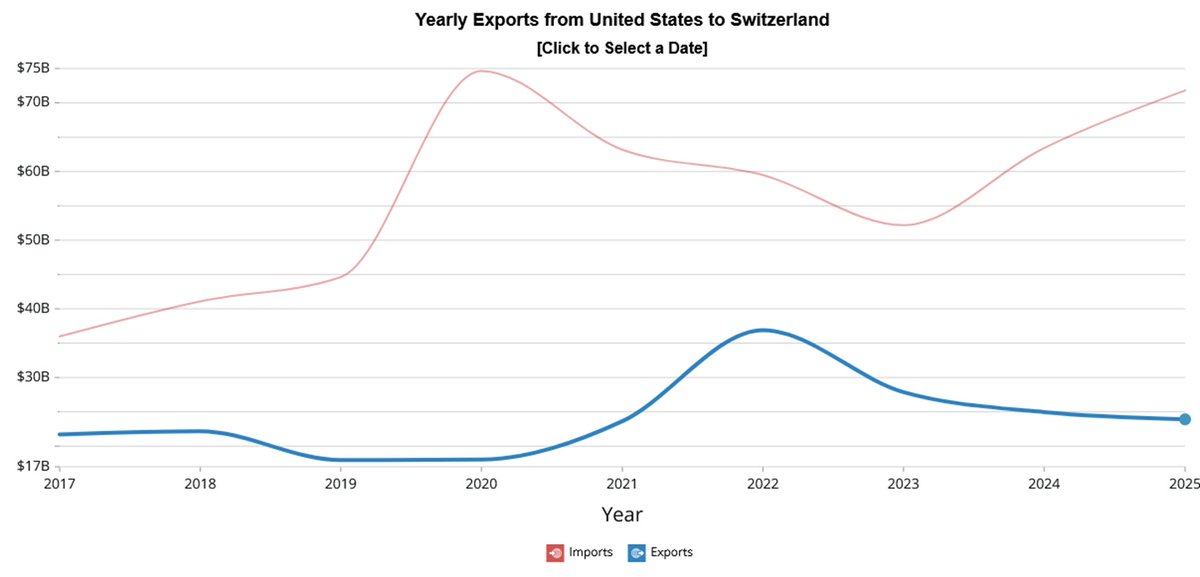
As the news that Kuwait may struggle to keep its oil output in the coming years, we like to explain some facts on "Base Declines". Kuwait is said to have 3.2mbpd capacity & produces 2.5mbpd in Oct 2021.
Kuwait is major, not minor for the market.
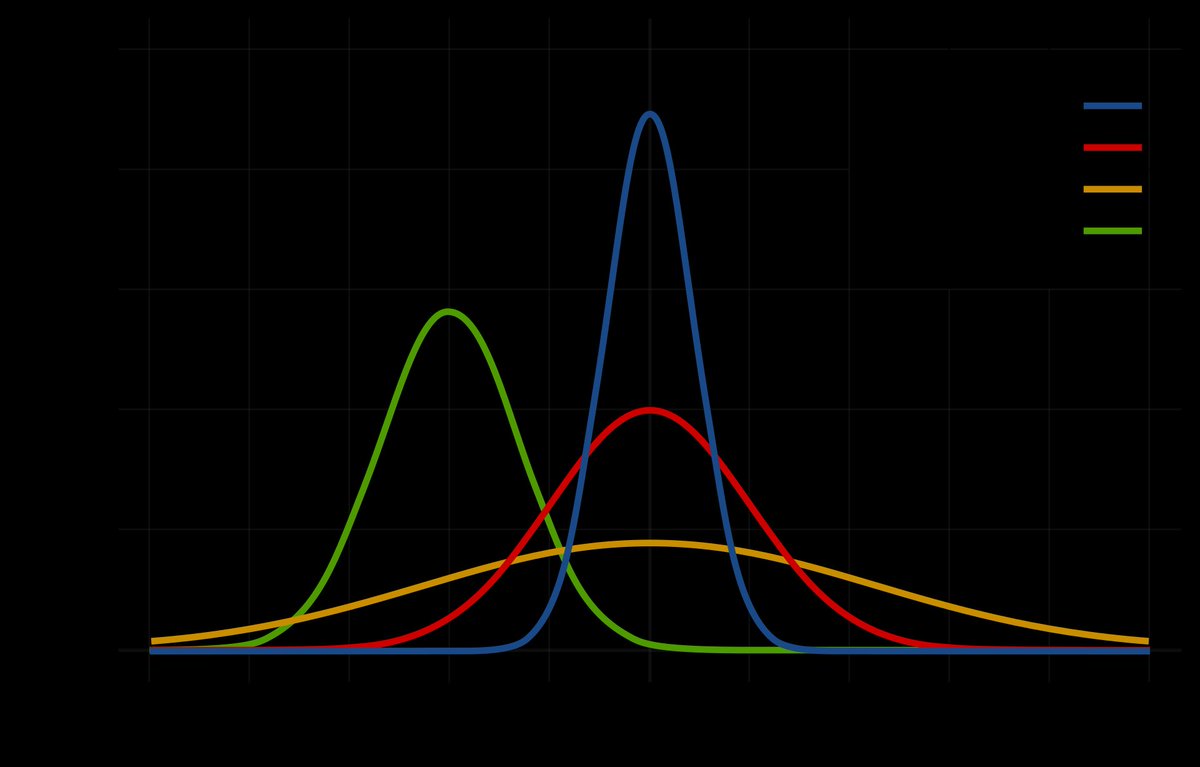
First, think of a conventional oil fields like a "normal distribution" or, after its mathematician, a "Gauss curve". As a field starts producing hydrocarbons, its production is stable or increases (with reservoir pressure & wells No) bf it enters in a "permanent decline".
2/...
Take the Cantarell offshore field in Mexico, one of a few "giant" conventional oil fields ever to be discovered. Do you see the "Gauss" curve below? In May 2021, Cantarell was down to 90kbpd, a fraction of its 2mbpd peak production in 2004.
3/...
Now, let us do that for all 65,000 conventional oil fields in the world & we basically get - Gauss again!
Oil & gas is an extractive industry. If world production needs to be stable, annual reinvestment (replacement of production) is required or global supplies decline.
4/..
More concretely, back in 2018 maturing fields around the globe declined at around 6% pa as reservoir pressure of oil fields globally decrease over time until the production rate eventually declines to a point at which it no longer produces profitable amounts.
5/...
In 2018, the IEA assumed 51 Mbpd of production to be in permenant decline. At 6% annual decline, operators need to replace 3.1 Mbpd with new projects EACH YEAR just to stay still. That is a lot of oil in an industry that is happy to find a new fields with 100mb size.
6/...
Again, in this decade the oil industry needs to replace one "North Sea" each year to keep production stable as ageing oil fields lost more than 3mbpd per year.
7/...
Is the industry re-investing enough? Of course not.
If anything, the industry continues to reduce investments due to Covid-19 & ongoing ESG demands ("Green Shift").
Worse, think about the signalling effect of SPR releases in that context to get lower prices!?
8/
So if anything, the industry lost potentially up to 4mbpd of barrels in the past 18 months in addition to the impact of project delays or increased decline rates due to "over-production".
9/...
Again, under-investment is going to lead to unsustainable oil production in the near future as reserves deplete from a lack of replacement.
10/...
It gets worse, not only did the industry not invest enough, decline rates are likely to increase too, potentially from 6% to more like 8% or 9%.
11/...
And that is true for Non-OPEC or OPEC fields, as you can easily see from the below table.
Let me add a few more facts & figures and some high level observations about the United States goods trade deficits with Switzerland of some $20bn annually.
The Swiss government and certain companies have little reason to lament—these tariffs were foreseeable.
Yes, the real issue is their scale: 39% compared to Europe’s 15%, which clearly puts some Swiss exports at a competitive disadvantage. It is what it is.
And while I still believe this situation is fixable, we must be prepared for the worst-case scenario to persist—or even worsen, with potential new tariffs on pharmaceuticals (currently exempted).
So, who is at fault? As some of us learned in officer school during military service: the Bundesrat misjudged the fundamentals of strategic assessment—Lagebeurteilung (judgement of enemy situation). That needs to be addressed. Trump wants balanced trade. Address it. Period.
History is not kind to those who choose dreams over reality—or to the weak who paint themselves as victims.
Therefore, whether Trump’s trade deficit logic makes any sense whatsoever (which it clearly doesn't in the Swiss case) is beside the point.
He’s the president. He has communicated his views clearly and consistently for decades. Adapt. Take the man seriously.
Trustworthy or not, as lamented by President Keller Sutter is none of our business.
2/n @SecScottBessent @BobgonzaleBob
Let’s now take a closer look at Switzerland’s goods trade surplus with the United States.
At Burggraben, we rely on the OEC tool (a paywalled MIT spin-off) for robust global trade data as part of our investment analysis process of all sorts—so we can assess this with confidence. I hope our readers will appreciate the data quality shared herewith for free.
While the annual trade surplus has fluctuated in recent years, the underlying—or let’s call it intrinsic—gap consistently hovers around $20 billion, as the data below will show.
More concretely, Iran likely enriched some 250kg of HEU stockpiles since 2021. Worse, it also said to adds significant new capacities.
That material so far could quickly be turned into the fuel for the equivalent of 10 bombs, should Iran’s leadership take the political decision to pursue weapons, according to Bloomberg.
Here is my theory how the major incident - a so called blackout - occurred at 12:30 CET today in the power system of Spain & Portugal:
1/n
At the time of the incident, Spain and Portugal operated the grid at very high renewables share of about 66% - i.e solar (55%) and wind (11%; eolica)
2/n
While this isn’t unusual for Spain, it does mean that the grid operates with little inertia (resistance to change) during such time. The grid is therefore vulnerable to external effects…!
On this platform, certain perma bulls keep pushing a bullish crude narrative based on relative U.S. inventories—day after day, for three years now.
Their logic: Total U.S. crude inventories (including the SPR) are at 838 million barrels (orange line), 200 million barrels below the 10-year average → bullish!
Yet, inventories keep falling, and prices remain stuck in a range. Clearly, they are wrong.
1/9 @UrbanKaoboy @Iris62655179 @BrentRuditLeo
The problem with their logic?
a) The U.S. is no longer the marginal importer of crude oil—Asia is (or was).
b) U.S. inventories are artificially high on a 10-year average due to the shale boom, which took off in 2014. Shale growth and Covid distort the data, keeping inventories (ex SPR) elevated. So any 5- or 10-year comparison is meaningless—period.
2/n US Crude Oil Inventory ex SPR
Including SPRs, the picture looks more normalised - but not tight. But does the US really need 700mb of strategic reserves in 2025? I don't think so.
Yesterday, I shared a few thoughts that I’d like to expand on, especially given how volatile the current tariff landscape under this admin has become.
Navigating it isn’t just difficult—it’s nearly impossible to avoid missteps. Hopefully some traders will expand on my thoughts...
1/n
What do we know?
As at 23 March 2025, Comex copper price in New York is trading at 14% premium to LME in London. Buying a tonne of copper in NY costs $11,213 versus 9,842 in London, $1,371 per tonne more than in London.
2/n
Why is that? Because of tariff FEARS, not tariffs.
Traders are hedging future risk of potential tariffs on all forms of the raw material, such as cathodes, concentrates, ores, and even scrap. But there aren't such tariffs in place for copper yet (unlike alumnium).
The current Comex price action in the U.S. is basically a Trump tariff trade mirage and is otherwise as misleading of fundaments as the May 2024 price action of which I warned on multiple occasions.
1/n $/pound
In May 2024 however, U.S. price action was more in synch with London. But it didn't reflect weak Chinese housing & construction fundamentals which has been 15-30% of GLOBAL copper use for the past two decades. Today, U.S. prices trade as if borders close tomorrow.
2/n Comex - LME arb in $/t
Unlike May 2024, copper blue chips like $FCX, however, do not buy the rally. So at least it seems that the equity market understands the tariff aspect of the copper price mirage.