
TAKING PROFIT 101 THREAD
I felt this was a thread I needed to post as I get many DMs unsure of how, and when to take profit.
Taking profit is very important and without doing it you don’t make money .. Simple as that ‼️
Please like and retweet if you find this helpful ❤️
I felt this was a thread I needed to post as I get many DMs unsure of how, and when to take profit.
Taking profit is very important and without doing it you don’t make money .. Simple as that ‼️
Please like and retweet if you find this helpful ❤️
Now taking profit will be something unique to different people. Reason being is some people are investors (Holding assets for years) .. Or some people are traders and will take profit depending on whether they are swing trading or scalping ‼️
So to keep it simple I am just going to go over different techniques or when to take profit. And these can be applied to different strategies and time frames .. So let’s begin legends
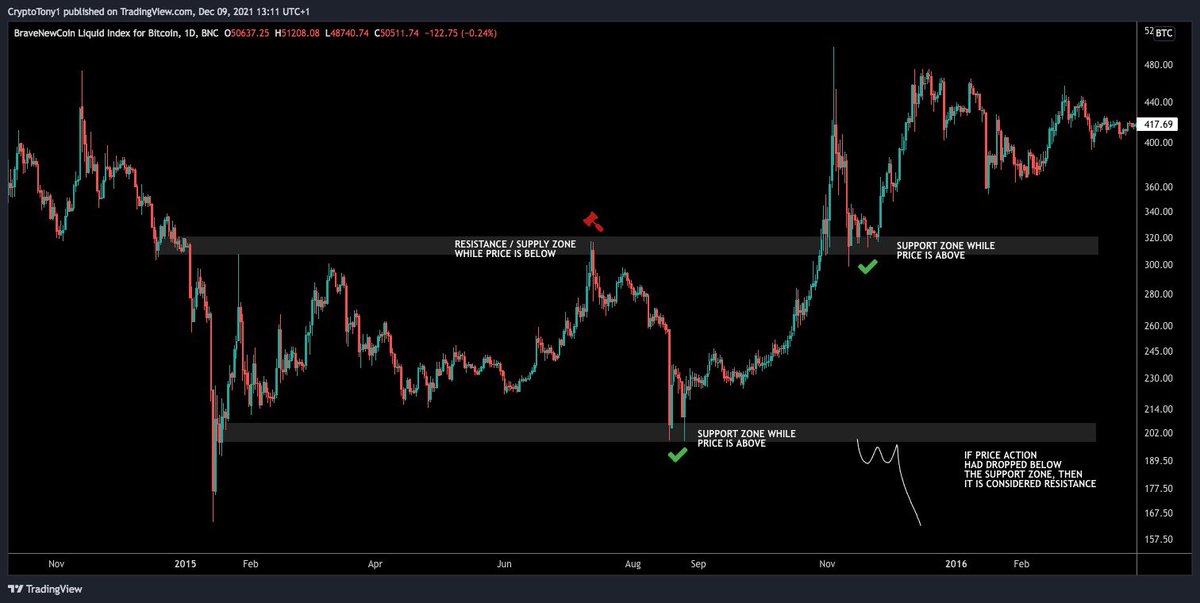
TAKING PROFIT AT RESISTANCE
This is the simplest way to take profit and applies if you are in a long or spot position. Before I go into detail you must understand what a Resistance or Supply zone is.
This is a level overhead of price action and is where sellers are dominant
This is the simplest way to take profit and applies if you are in a long or spot position. Before I go into detail you must understand what a Resistance or Supply zone is.
This is a level overhead of price action and is where sellers are dominant
So to take profit I would simply place my sell orders and take profit targets in the resistance zone. Please see the image below for an example 

TAKING PROFIT AT SUPPORT
Taking profit at support is relevant to traders who are shorting price action. A short position is where you are looking for the price to depreciate rather than appreciate on a given asset
Taking profit at support is relevant to traders who are shorting price action. A short position is where you are looking for the price to depreciate rather than appreciate on a given asset
Those who Short will want to take profit at the Demand / Support zone. Similar to a resistance zone, but this is where buyers will be dominant as opposed to sellers in a resistance zone. I would place take profits in the demand / support zone cluster
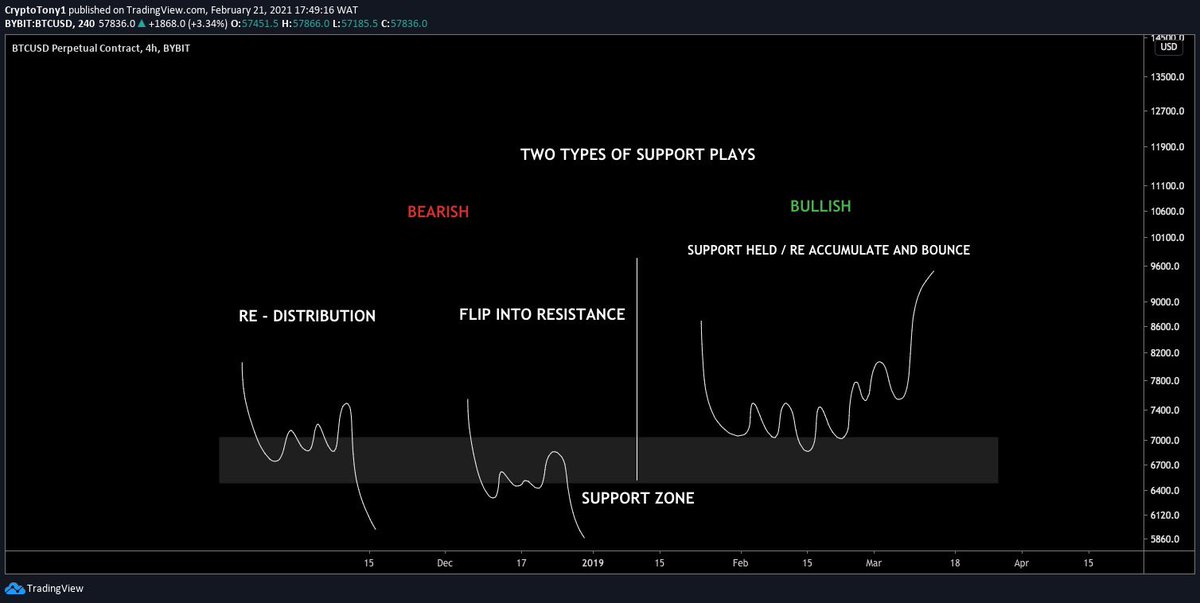
Below is an example of where we can see support and resistance on #Bitcoin and when we consider each cluster as support or resistance
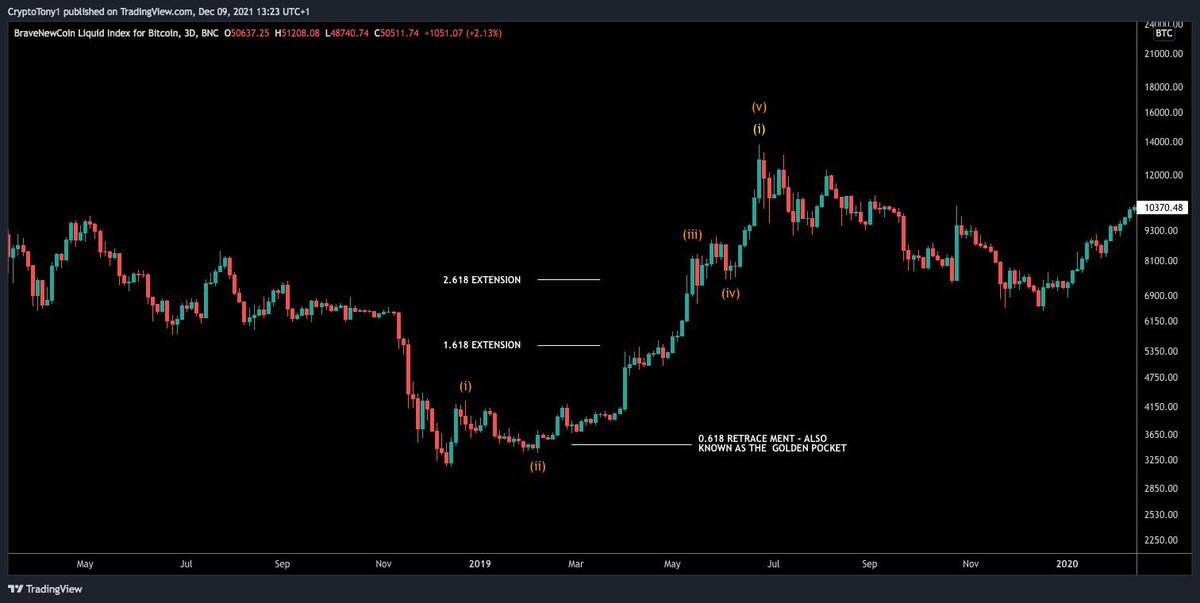
TAKING PROFIT - FIBONACCI EXTENSIONS / RETRACEMENT
Now most of you know I work a lot with Elliott wave and I use Fibonacci retracement and extensions in conjunction with this. Retracements assist with short profit taking .. And extensions help with long or spot profit taking
Now most of you know I work a lot with Elliott wave and I use Fibonacci retracement and extensions in conjunction with this. Retracements assist with short profit taking .. And extensions help with long or spot profit taking
So to take profit using Retracements I look for the golden pocket (0.618) as a rule of thumb. And for extensions I like to take profit on the wave 3 of the impulse wave. This will be the 1.618 and the 2.618 Fibonacci extension
There is more to it, but this is the general idea
There is more to it, but this is the general idea
I hope you have found this thread helpful legends. Please like and retweet to share with as many legends as possible 😎
• • •
Missing some Tweet in this thread? You can try to
force a refresh


