🚨Preprint Alert🚨IT'S HERE!
For the first time, we use a large-scale controlled study of O&G #methane emissions to answer a basic question: How effective are commonly used Leak Detection & Repair (LDAR) programs?
There's a LOT we learnt here. Thread: 1/ eartharxiv.org/repository/vie…
For the first time, we use a large-scale controlled study of O&G #methane emissions to answer a basic question: How effective are commonly used Leak Detection & Repair (LDAR) programs?
There's a LOT we learnt here. Thread: 1/ eartharxiv.org/repository/vie…
https://twitter.com/arvindpawan1/status/1468639663686664200

EPA has proposed regulations to reduce #methane emissions from O&G sector. If global energy sector methane were a country, it would be the third largest emitter behind only China & US.
Key part of these regs are leak detection & repair (LDAR) programs. 2/ washingtonpost.com/climate-enviro…
Key part of these regs are leak detection & repair (LDAR) programs. 2/ washingtonpost.com/climate-enviro…
LDAR program are where O&G operators survey their facilities with IR cameras to find and fix leaks (see NYT article for videos).
But, we didn't really know if these LDAR programs are effective in reducing #methane, beyond anecdotal evidence. Until now! 3/ nytimes.com/interactive/20…
But, we didn't really know if these LDAR programs are effective in reducing #methane, beyond anecdotal evidence. Until now! 3/ nytimes.com/interactive/20…
Why? Because it's hard. Need to meet 5 conditions:
1. Control group where leaks are not repaired
2. Treatment group where leaks are repaired
3. Measure all emissions incl. vents, not just leaks
4. Repeat measurements
5. Avoid selection bias (select only low emitting sites) 4/
1. Control group where leaks are not repaired
2. Treatment group where leaks are repaired
3. Measure all emissions incl. vents, not just leaks
4. Repeat measurements
5. Avoid selection bias (select only low emitting sites) 4/
But that's what we did.
We randomly selected ~180 O&G sites in Alberta.
We split them into 4 groups - 1 control (C) & 3 treatment (T1-3) - with ~45 sites each.
Control - operators not informed about leaks.
Treatment - operators asked to fix leaks.
Survey schedule below. 5/
We randomly selected ~180 O&G sites in Alberta.
We split them into 4 groups - 1 control (C) & 3 treatment (T1-3) - with ~45 sites each.
Control - operators not informed about leaks.
Treatment - operators asked to fix leaks.
Survey schedule below. 5/

To track emissions over time & across surveys, we put physical tags on leaks. When operators fix leaks, they note a 'date of repair' on tag (that's how we know leaks were fixed).
No tags were left on leaks at control sites.
Based on these tags, we have 4 treatment effects. 6/
No tags were left on leaks at control sites.
Based on these tags, we have 4 treatment effects. 6/

We find repairs are highly effective. Look at comparison between tagged leaks that were not repaired vs. tagged leaks that were repaired.
Gray: initial survey
Pink: follow-up survey
1) After repairs, emissions ~0.
2) Even if not repaired, emissions do not grow with time. 7/
Gray: initial survey
Pink: follow-up survey
1) After repairs, emissions ~0.
2) Even if not repaired, emissions do not grow with time. 7/

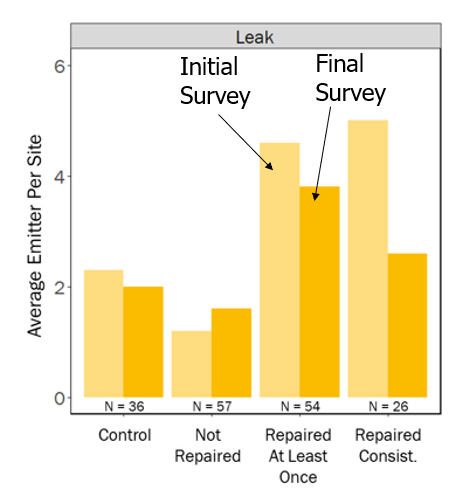
At treatment sites that were repaired consistently, average number of leaks reduced by 50% (5 to 2.5).
At control, little change (2.2 to 2.0) - slight decrease possibly from voluntary maintenance.
At treatment sites where repairs were *not* done, leaks went up (1.3 to 1.6). 8/
At control, little change (2.2 to 2.0) - slight decrease possibly from voluntary maintenance.
At treatment sites where repairs were *not* done, leaks went up (1.3 to 1.6). 8/
What does this mean?
First, high survey frequency + repairs ➡️fewer leaks.
Second, voluntary inspection many reduce emissions, but reductions much smaller compared to LDAR programs➡️importance of regs.
Third, consistent repairs after surveys key to reducing emissions. 9/
First, high survey frequency + repairs ➡️fewer leaks.
Second, voluntary inspection many reduce emissions, but reductions much smaller compared to LDAR programs➡️importance of regs.
Third, consistent repairs after surveys key to reducing emissions. 9/
Not all operators are created equal. You can see ~2 orders of magnitude difference in average site emissions across 18 operators. We can speculate why:
1) Different asset portfolio (more oil production, more emissions)
2) Different maintenance practices
3) Super-emitters 10/
1) Different asset portfolio (more oil production, more emissions)
2) Different maintenance practices
3) Super-emitters 10/

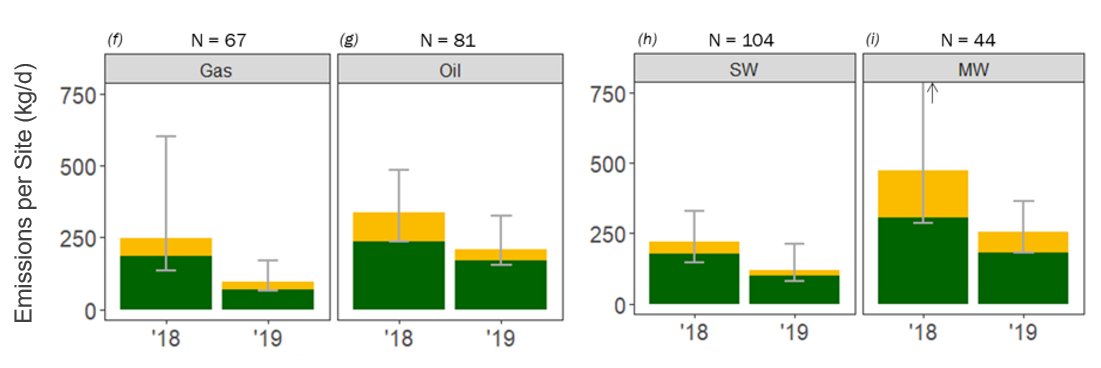
Not all sites are created equal.
Oil sites emit, on average, 2x that of gas sites.
Sites with multiple wells emit, on average, 2x that of sites with single wells. 11/
Oil sites emit, on average, 2x that of gas sites.
Sites with multiple wells emit, on average, 2x that of sites with single wells. 11/
Venting is a much bigger problem than leaks. Part of the reason is the way we classify many emissions as vents even though they can be fixed (e.g., open thief hatch on a tank).
This is why LDAR surveys can help find anomalous vents even if they are only targeted at leaks. 12/
This is why LDAR surveys can help find anomalous vents even if they are only targeted at leaks. 12/

Last thing: Tanks and pneumatics are the biggest sources of emissions. Look at distributions of tank and non-tank emissions and how they changed over the course of the year!
In 2019,
Avg. tank emission = 105 kg/d
Avg. non-tank emission = 14 kg/d, order of magnitude smaller. 13/
In 2019,
Avg. tank emission = 105 kg/d
Avg. non-tank emission = 14 kg/d, order of magnitude smaller. 13/

There's a LOT more in the paper! I was a @Stanford post-doc when this start, now I'm faculty at @UT_PGE! And big congrats to @Lyra_Wang, who led the analysis!
These are preliminary results. We are releasing all data so others can conduct more analyzes! /End
These are preliminary results. We are releasing all data so others can conduct more analyzes! /End
For those who asked: @drvolts @StevenMufson @dino_grandoni @ProfVonfischer @MikeLeeFW @johnupton @lorakolodny
This is a preprint and will undergo external peer review, but we wanted to get data & results out so insights can be helpful for #methane regs.
This is a preprint and will undergo external peer review, but we wanted to get data & results out so insights can be helpful for #methane regs.
• • •
Missing some Tweet in this thread? You can try to
force a refresh