CPI up 0.8% in November, 6.8% for the last 12 months. A lot of that was volatile energy which is coming down.
Core up 0.5%, or 4.9% for the last 12 months.
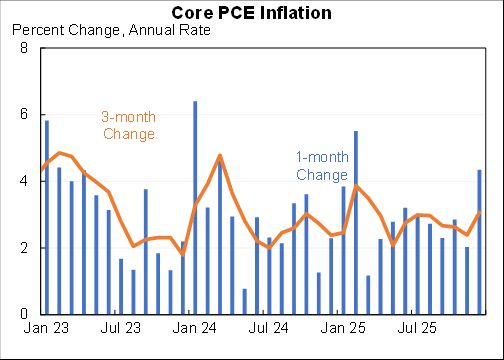
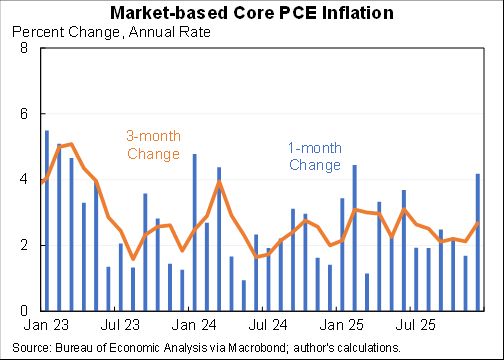
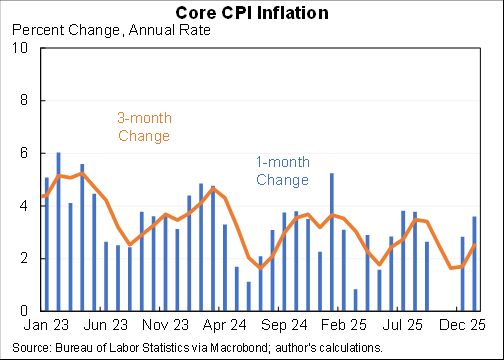
Stripping out some volatile pandemic items from core the underlying still quite high and broadly trending up.
Core up 0.5%, or 4.9% for the last 12 months.
Stripping out some volatile pandemic items from core the underlying still quite high and broadly trending up.

Some items were unusually large in Nov & likely will be fall in the future (eg gasoline +6.1% & used cars at +2.5%).
But some items go the other way (rent/OER was 0.4% & that pace will almost certainly pick up, hospitals were -0.3% and transpo was 0.7% with more room to grow.)
But some items go the other way (rent/OER was 0.4% & that pace will almost certainly pick up, hospitals were -0.3% and transpo was 0.7% with more room to grow.)
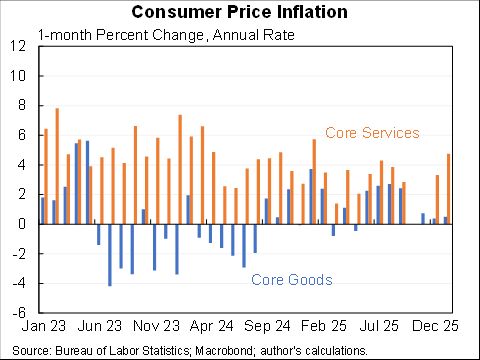
One source of upward price pressure in November appears to have been the easing of the delta variant. The virus likely (but not definitely) reduced inflation in Aug/Sep/Oct. Pandemic services now rising again--but still have a ways to go.
https://twitter.com/jasonfurman/status/1463518560068648962?s=20

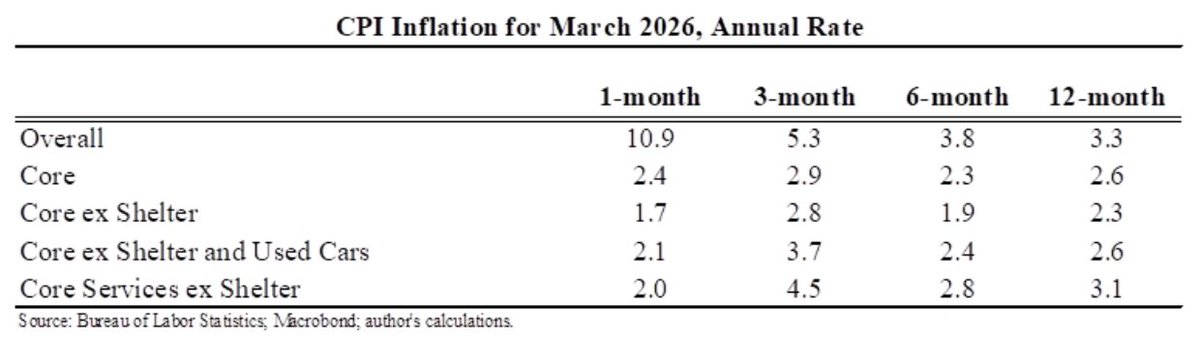
Using different time horizons can be useful. More recent data is both more up-to-date but also has more noise. Here are some horizons for core CPI at an annual rate:
1 month: 6.6%
3 months: 5.6%
6 months: 5.5%
12 months: 5.0%
24 months: 3.3%
1 month: 6.6%
3 months: 5.6%
6 months: 5.5%
12 months: 5.0%
24 months: 3.3%

As for why rent and owner's equivalent rent will increase, a variety of measures show mostly new leases higher than the average. As more leases come up for renewal will boost the overall. Plus technical measurement issues lead CPI rent/OER to lag.

What does this mean for workers? It hasn't been good so far. Real wage are down about 1% since February 2020 and are 2.9% below trend. (I'm using a slightly unorthodox mixture of the ECI which is composition adjusted and AHE for the additional months which are not.)

Much better for lower-wage workers. The bottom quarter of workers have seen wage gains outpace inflation but by less than before. The second quartile had been positive but has now turned negative.

Inflation is up everywhere. But it is up *much* more in the US. Look compared to Euro area over the last 24 months at an annual rate (a 12 month window would tell mostly the same story but distorted by base effects). The 2pp gap (or 4pp cumulative) has been roughly constant.

This is the US vs. euro area comparison for core CPI, similar story. Note EA < 2% target so most of the inflation there is base effects & volatile food and energy, the US story very different.
(Technical note: previous tweet used comparable HICP measures, this one does not.)
(Technical note: previous tweet used comparable HICP measures, this one does not.)

Those are all the charts I have for you this morning. Will put up some more thoughts later but for now will leave you with a positive prediction & a normative view in the final two tweets in this thread.
POSITIVE PREDICTION: Monthly increases in CPI will come down a lot in the next few months. But core CPI will still be avg ~0.4/month for a while (or ~5% annual rate) as some prices moderate (e.g., autos) but others get worse (e.g., rent).
(My positive prediction assumes that omicron does not cause widespread shutdowns in the US economy or reductions in travel and dining. If the reaction to omicron is larger than I expect then inflation would be lower, just like the delta virus likely kept inflation lower.)
NORMATIVE:
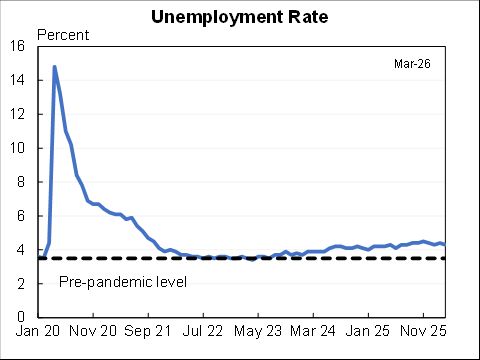
Monetary policy: Continue to pivot both because the large decline in unemployment/UI claims means we're closer to max employment & further from inflation goal.
--Fiscal policy needs to stay focused on our medium/long-term problems, don't get distracted by this!
FIN
Monetary policy: Continue to pivot both because the large decline in unemployment/UI claims means we're closer to max employment & further from inflation goal.
--Fiscal policy needs to stay focused on our medium/long-term problems, don't get distracted by this!
FIN
• • •
Missing some Tweet in this thread? You can try to
force a refresh