Pierre Lionnet Profile picture
Dec 13, 2021 6 tweets 4 min read Read on X
@VirginOrbit #SPAC filings reveal the most insane market assessment ever. IDK who these 'Prophesy' guys are, but in 2019 the total launch market was 8B$ in value. The launch market for satellites <500kg (up to 'Mini') was <1B$/year in the past 5 years. 1/
sec.gov/Archives/edgar… ImageImage
I don't know if anybody will be held accountable for such a blatant overestimate of the small satellite launch market value, but luring investors in believing this business is 8B$/year is incredibly dishonest IMHO, particularly in light of the usual mantra of 'reduced costs'. 2/ Image
If that market value was correct, the average price of launching 42t of mini satellites (<500kg) in 2019 would have been close to 200k$/kg. A preposterous value: we know that small launch is expensive, but not THAT expensive! 3/ Image
If the management of @VirginOrbit really believes it is operating in a small launch market segment worth 8B$ in 2019 I think we should really worry for the company. If management knows this value is #bullshit then we can wonder why it is found in the SEC filings for the SPAC. 4/ Image
Of course if 1B$ can be "approximated" to 8B$ all this is fine. Similarly if by "small satellite" @VirginOrbit management consider any satellite under 15 tons, the statement is also correct. But let us recall that @VirginOrbit can only launch satellites (way) below 500kg. 5/ Image
In view of this I think that $NGCA Shareholders should think twice before approving the merger, and at least raise a few concerns on management ability to estimate the current market, and/or to proof read an important document. 6/ Image

• • •

Missing some Tweet in this thread? You can try to force a refresh
 

Keep Current with Pierre Lionnet

Pierre Lionnet Profile picture

Stay in touch and get notified when new unrolls are available from this author!

Read all threads

This Thread may be Removed Anytime!

PDF

Twitter may remove this content at anytime! Save it as PDF for later use!

Try unrolling a thread yourself!

how to unroll video
  1. Follow @ThreadReaderApp to mention us!

  2. From a Twitter thread mention us with a keyword "unroll"
@threadreaderapp unroll

Practice here first or read more on our help page!

More from @LionnetPierre

Oct 10
With @NedhirSahli we are regularly updating our launch events database, and today we had a closer look at the Falcon 9 Transporter missions. Let's share our findings in a little thread. #spacex #falcon9 #transporter
1/
When the Transporter missions were first proposed by SpaceX I was intrigued by the pricing system, and I was wondering whether the missions were able to yield a profit at all. My original 2021 post is here.
2/
Now that there have been 12 Transporter missions already, what are the stats?
First we note that the total mass deployed is not really improving, and, with the exception of T-1, is usually well below 3 tons/launch. A very small load for Falcon 9. Is it a demand problem?
3/ Image
Read 9 tweets
Oct 3, 2023
“Northrop was uncertain that the commercial market existed beyond guaranteed contracts to house NASA astronauts, and this is likely what led to its decision to drop a bid.”
I share this view. 1/
Moreover I believe that all these NASA “newspace” type of procurement contracts (COTS/CRS, CLD, CLPS…) will be a major disappointment for suppliers in the long run. 2/
Rather than creating a healthy new business environment for space system suppliers, they will hardly create a profitable market and will eventually drive vendors under water. 3/
Read 15 tweets
Aug 10, 2023
Interested in some @RocketLab #Electron launch data?
I've been compiling the last 3,5 available years of data from the 10-Q and 10-K reports, and have found a few intersting facts.
TL/DR:
- average unit price >6,1M$
- average mass launched: <90kg
- average price/kg: <70k$
1/
First, the general trend for Electron price is increasing.
See here the average unit price per launch per year.
Note that 2023, includes HASTE, a suborbital launch.
2/ Electron average unit price
The trend for price/kg seems to stabilise, at the very high value of >70k$/kg. Even considering the notion that Electron offers a bespoke service of high value, the cost/kg for customers is very high. Must be hard to close a business case with this (Note: 2023 excludes HASTE).
3/ Image
Read 5 tweets
Jul 14, 2023
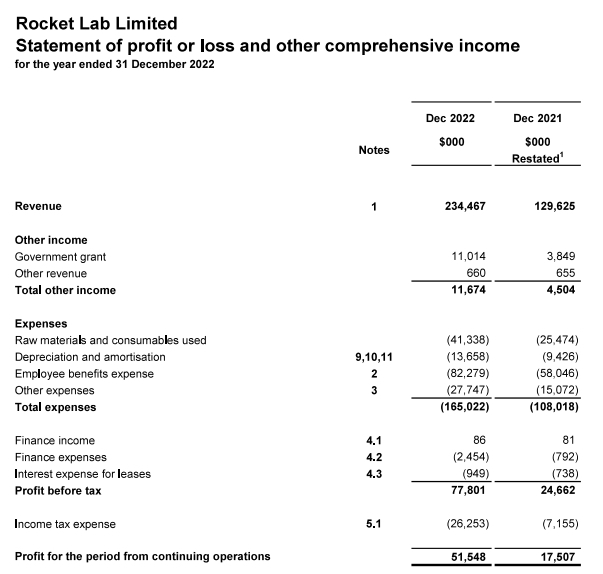
I have this bad habit of looking into financial statements of space companies. Today I found it interesting to compare side by side the financial statements of @RocketLab USA and its NZ subsidiary.
1/
The NZ subsidiary of RL provides exclusive services and products to its USA parent. While goods are sold 'at cost', for services the NZ sub applies a 'margin to cost of 5 to 10%'.
2/ Image
As a result, the NZ subsidiary cannot lose money, since all it does is work for RL USA with a guaranteed coverage of costs. At the end of 2022 it even made a profit before tax worth 77 MNZD (50M$), and 24 MNZD in 2021.
3/ Image
Read 7 tweets
May 10, 2023
Let's do some simple math to compare broadband satellute systems then. The main metrics will be capacity/kg in orbit. I will also consider the useful satellite life expectancy to be complete.
1/
Assumptions on Starlink useful capacity are many. There seems to be consensus between 15 and 20 Gbps/satellite (V1). This would equate to up to 0,08 Gbps/kg/year (assuming 250kg) and 0,4 Gbps/kg over 5 years of usage.
2/

blog.apnic.net/2021/06/02/eve…
Now lets' compare to recent broadband satellites launched in GEO. Eutelsat Konnect VHTS claims 500Gbps for 6,4 tons. That's 0,078 Gpbs/kg, like Starlink, or 1,17 Gbps/kg over 15 years of usage.
3/
thalesgroup.com/en/worldwide/s…
Read 8 tweets
Feb 5, 2023
So we have a new space SPAC breeding. Last year I worked with a master student on a toolbox to analyse the SPAC thesis. Let's see how Intuitive Machines performs on our indicators. 👉This is NOT investment advice.
1/
First the source: the analyst day presentation is here: intuitivemachines.com/_files/ugd/7c2…
There is one first red flag. The complete financial statements for 2021 and 2020 are not included in it. They should.
2/
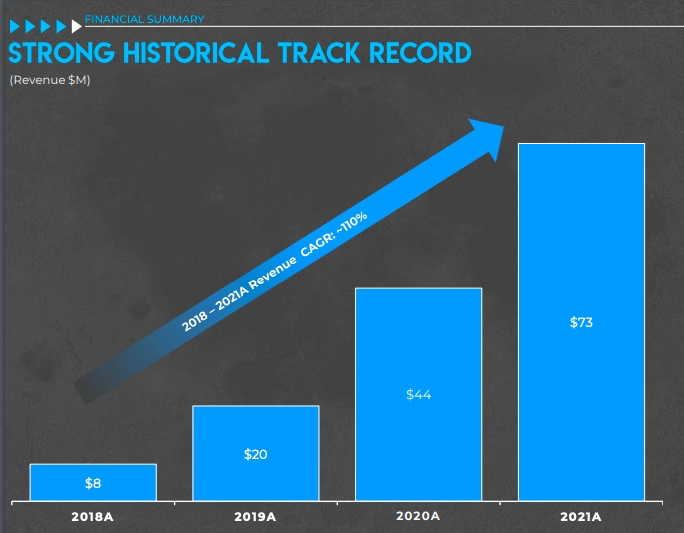
Instead we are treated with the value of sales 2018-2021, that shows an impressive ramp-up. Nice, but how much loss was accumulated in the period? And since 2013? Would be nice to know.
3/ Image
Read 24 tweets

Did Thread Reader help you today?

Support us! We are indie developers!


This site is made by just two indie developers on a laptop doing marketing, support and development! Read more about the story.

Become a Premium Member ($3/month or $30/year) and get exclusive features!

Become Premium

Don't want to be a Premium member but still want to support us?

Make a small donation by buying us coffee ($5) or help with server cost ($10)

Donate via Paypal

Or Donate anonymously using crypto!

Ethereum

0xfe58350B80634f60Fa6Dc149a72b4DFbc17D341E copy

Bitcoin

3ATGMxNzCUFzxpMCHL5sWSt4DVtS8UqXpi copy

Thank you for your support!

Follow Us!

:(