Tivadar Danka Profile picture
Dec 15, 2021 9 tweets 3 min read Read on X
Expected value is one of the most fundamental concepts in probability theory and machine learning.

Have you ever wondered what it really means and where it comes from?

The formula doesn't tell the entire story right away.

💡 Let's unravel what is behind the scenes! 💡
First, let's take a look at a simple example.

Suppose that we are playing a game. You toss a coin, and

• if it comes up heads, you win $1,
• but if it is tails, you lose $2.

Should you even play this game with me? 🤔

We are about to find out!
After 𝑛 rounds, your earnings can be calculated by the number of heads times $1 minus the number of tails times $2.

If we divide total earnings by 𝑛, we obtain the average earnings per round.

What happens if 𝑛 approaches infinity? 🤔
As you have probably guessed, the number of heads divided by the number of tosses will converge to the probability of a single toss being heads.

In our case, this is 1/2.

(Similarly, tails/tosses also converge to 1/2.)
So, your average earnings per round are -1/2. This is the expected value. So, you'll lose in the long run.

(By the way, you definitely shouldn't play this game.)

💡 How can we calculate the expected value for a general case? 💡
Suppose that, similarly to the previous example, we can quantify the outcome of your experiments. (Like throwing a dice or making a bet at the poker table.)

The expected value is just the average outcome you have per experiment when you let it run infinitely! 🤯
The formula above is simply the expected value in English.

If we formally denote the variable describing the experiment's outcome with 𝑋 and its possible values with 𝑥ᵢ, we get back the formula in the first tweet.

It looks much easier now!
Having a deep understanding of math will make you a better engineer. I want to help you with this, so I am writing a comprehensive book about the subject.

If you are interested in the details and beauties of mathematics, check out the early access!

tivadardanka.com/book/
Another (very interesting) explanation: expected value as center of mass!

• • •

Missing some Tweet in this thread? You can try to force a refresh
 

Keep Current with Tivadar Danka

Tivadar Danka Profile picture

Stay in touch and get notified when new unrolls are available from this author!

Read all threads

This Thread may be Removed Anytime!

PDF

Twitter may remove this content at anytime! Save it as PDF for later use!

Try unrolling a thread yourself!

how to unroll video
  1. Follow @ThreadReaderApp to mention us!

  2. From a Twitter thread mention us with a keyword "unroll"
@threadreaderapp unroll

Practice here first or read more on our help page!

More from @TivadarDanka

Jul 3
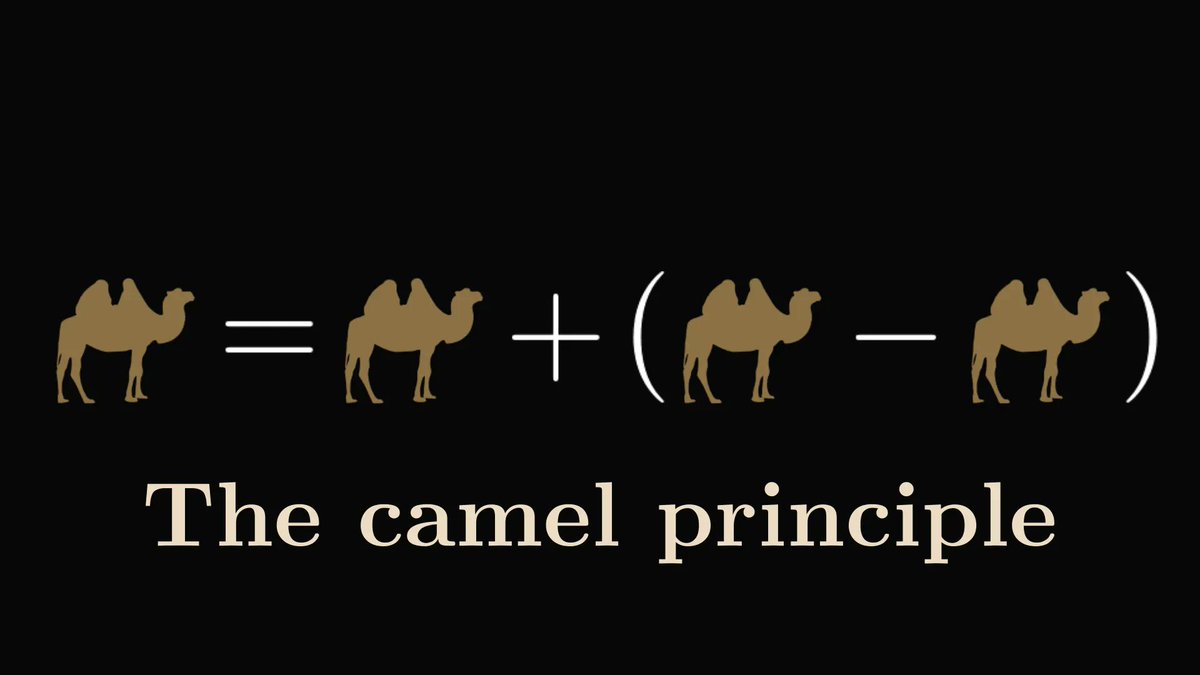
Behold one of the mightiest tools in mathematics: the camel principle.

I am dead serious. Deep down, this tiny rule is the cog in many methods. Ones that you use every day.

Here is what it is, how it works, and why it is essential. Image
First, the story.

The old Arab passes away, leaving half of his fortune to his eldest son, third to his middle son, and ninth to his smallest.

Upon opening the stable, they realize that the old man had 17 camels. Image
This is a problem, as they cannot split 17 camels into 1/2, 1/3, and 1/9 without cutting some in half.

So, they turn to the wise neighbor for advice. Image
Read 18 tweets
Jul 3
The single biggest argument about statistics: is probability frequentist or Bayesian?

It's neither, and I'll explain why.

Buckle up. Deep-dive explanation incoming. Image
First, let's look at what is probability.

Probability quantitatively measures the likelihood of events, like rolling six with a dice. It's a number between zero and one.

This is independent of interpretation; it’s a rule set in stone. Image
In the language of probability theory, the events are formalized by sets within an event space.

The event space is also a set, usually denoted by Ω.) Image
Read 33 tweets
Jul 2
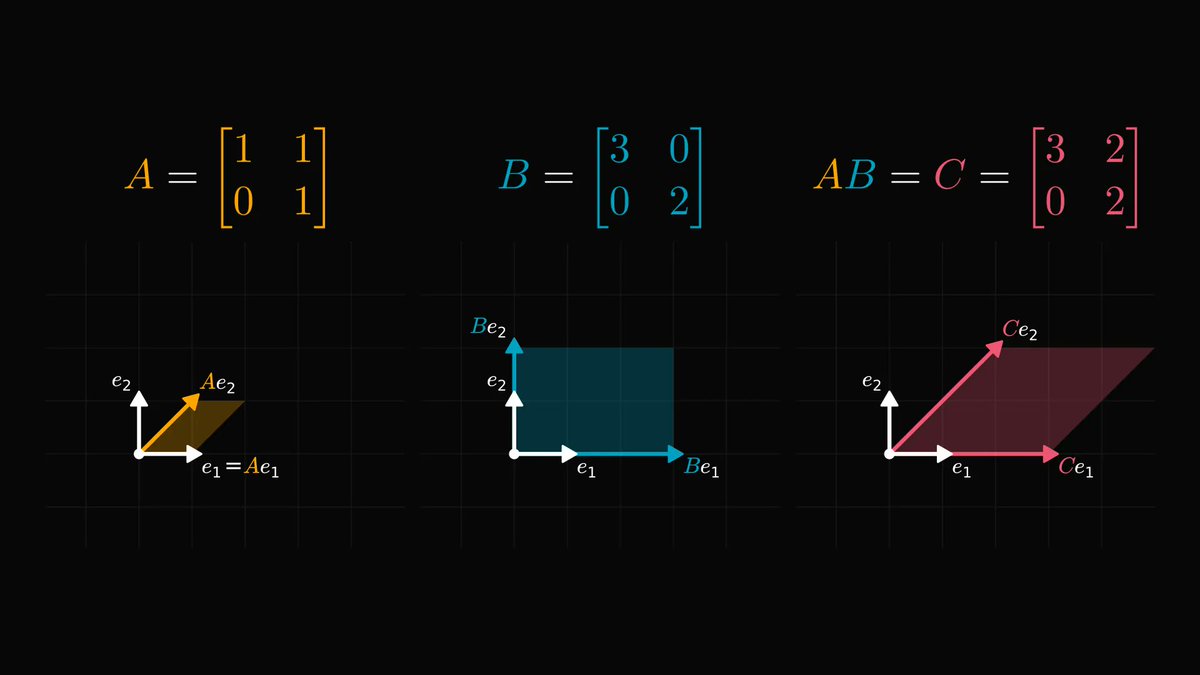
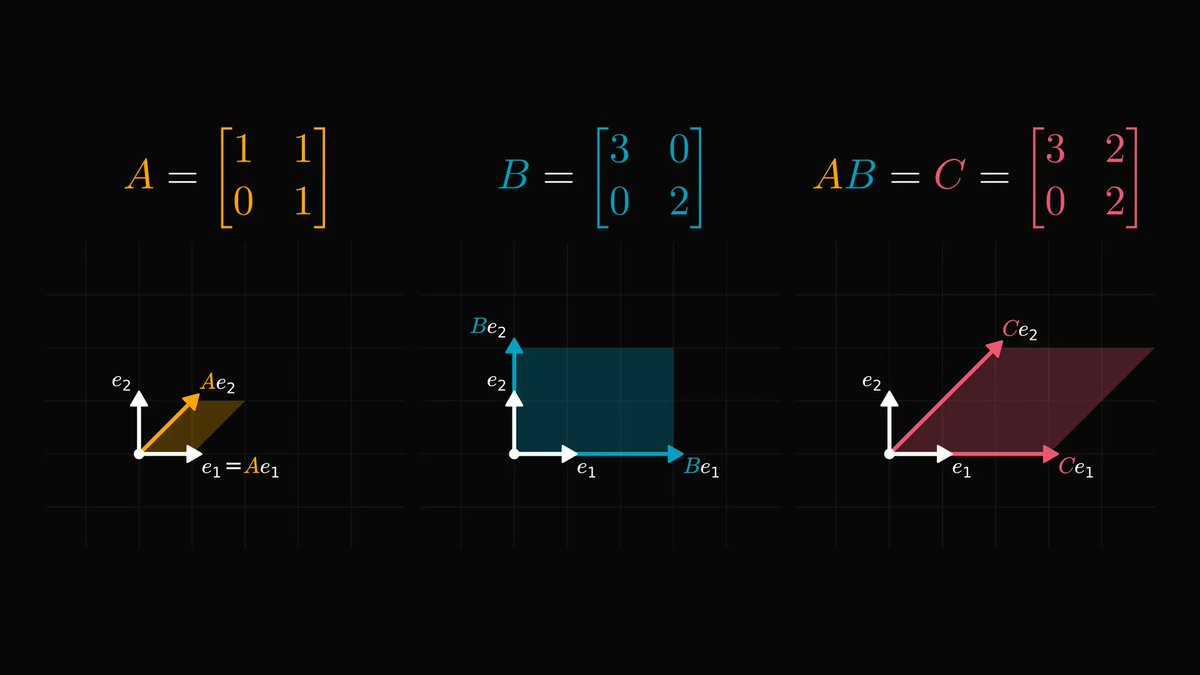
Matrix multiplication is not easy to understand.

Even looking at the definition used to make me sweat, let alone trying to comprehend the pattern. Yet, there is a stunningly simple explanation behind it.

Let's pull back the curtain! Image
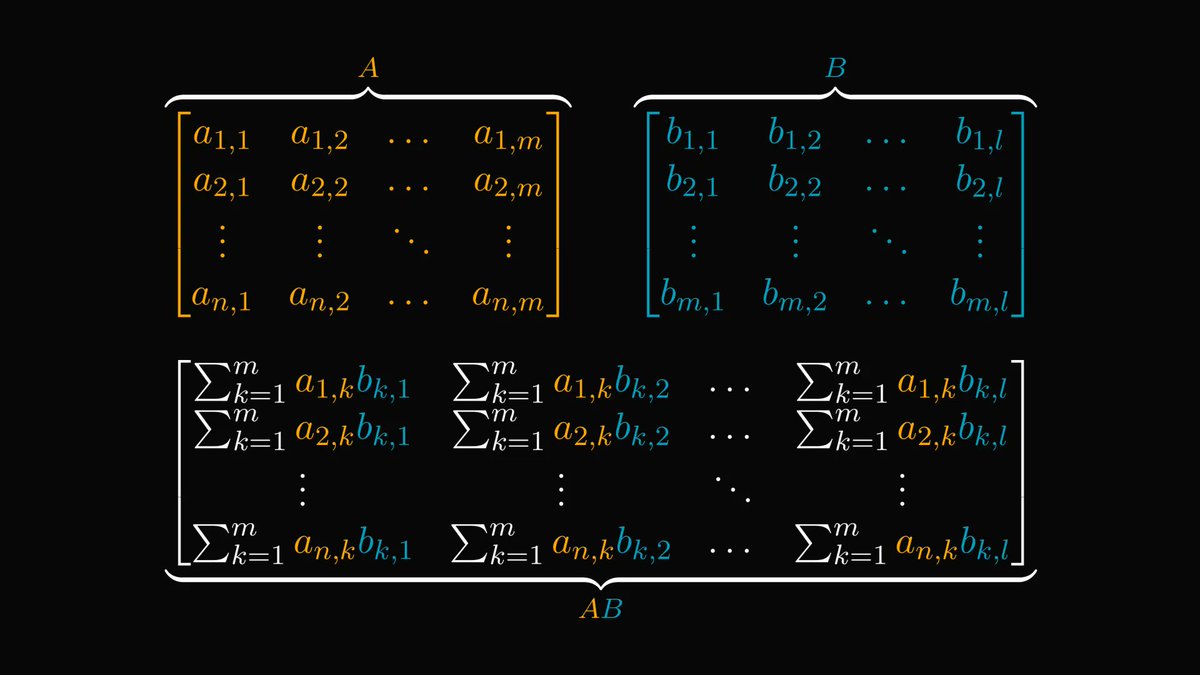
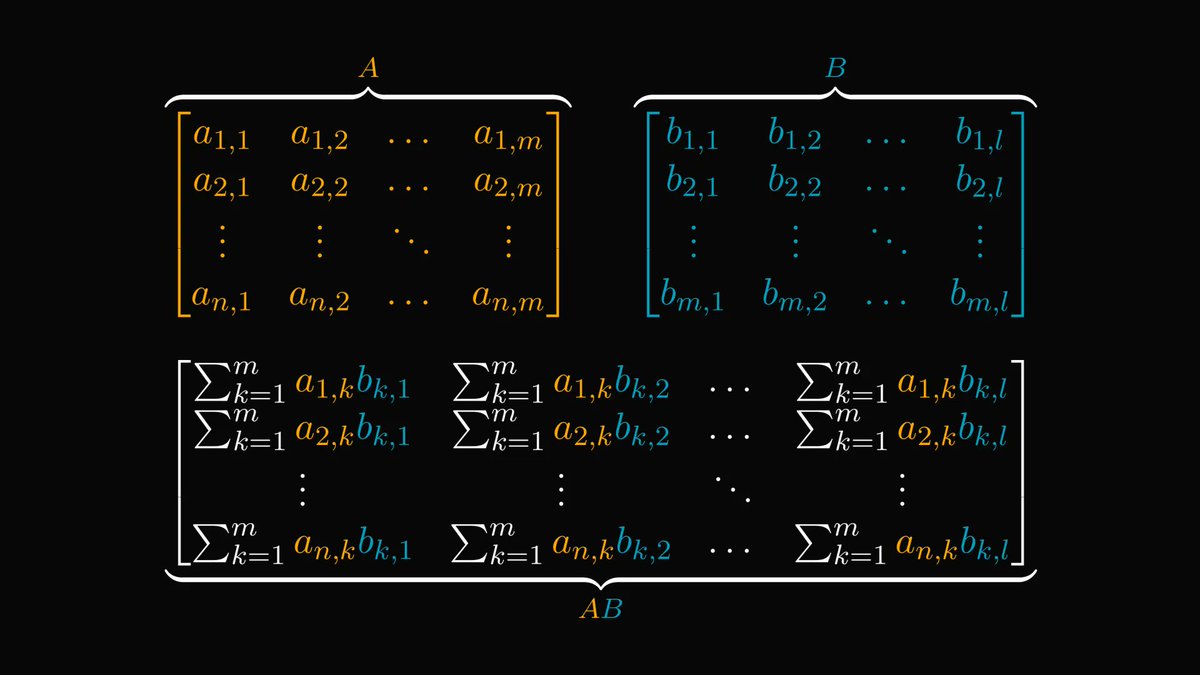
First, the raw definition.

This is how the product of A and B is given. Not the easiest (or most pleasant) to look at.

We are going to unwrap this. Image
Here is a quick visualization before the technical details.

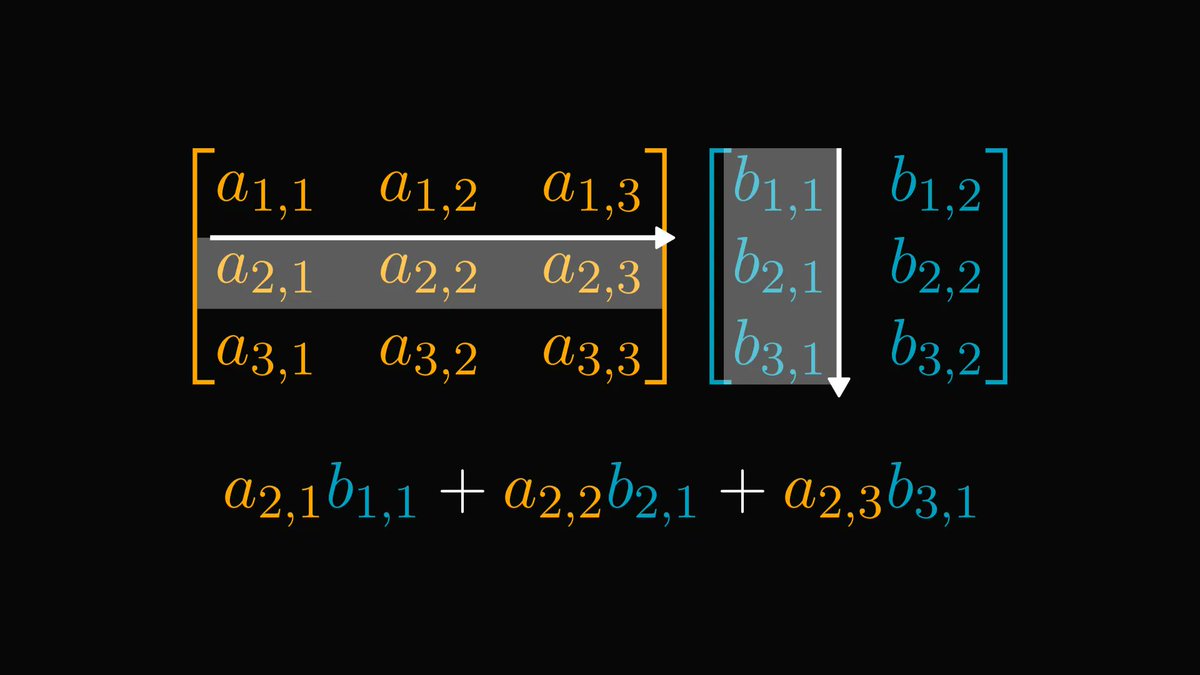
The element in the i-th row and j-th column of AB is the dot product of A's i-th row and B's j-th column. Image
Read 16 tweets
Jul 1
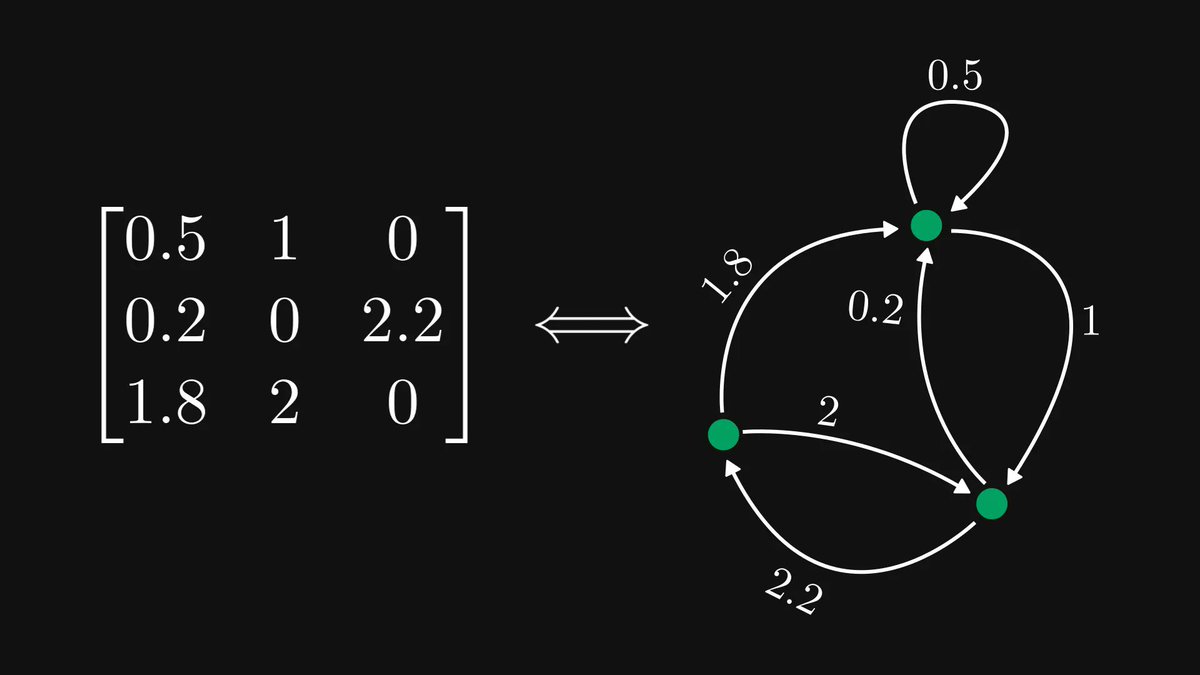
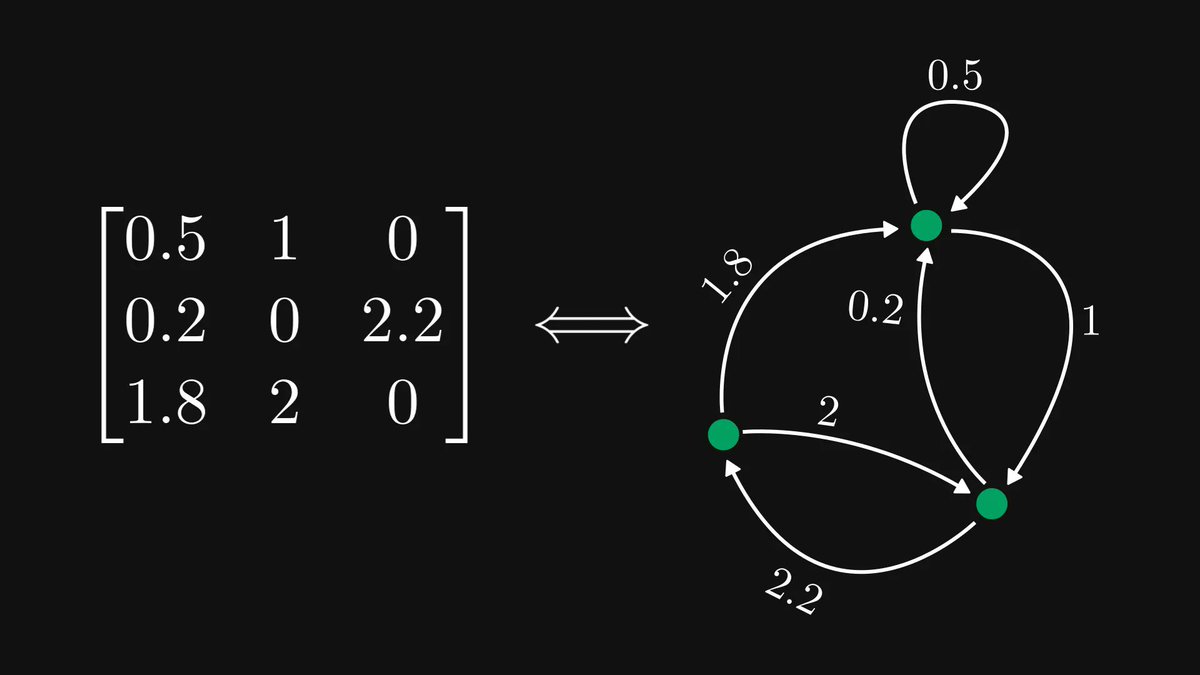
The single most undervalued fact of linear algebra: matrices are graphs, and graphs are matrices.

Encoding matrices as graphs is a cheat code, making complex behavior simple to study.

Let me show you how! Image
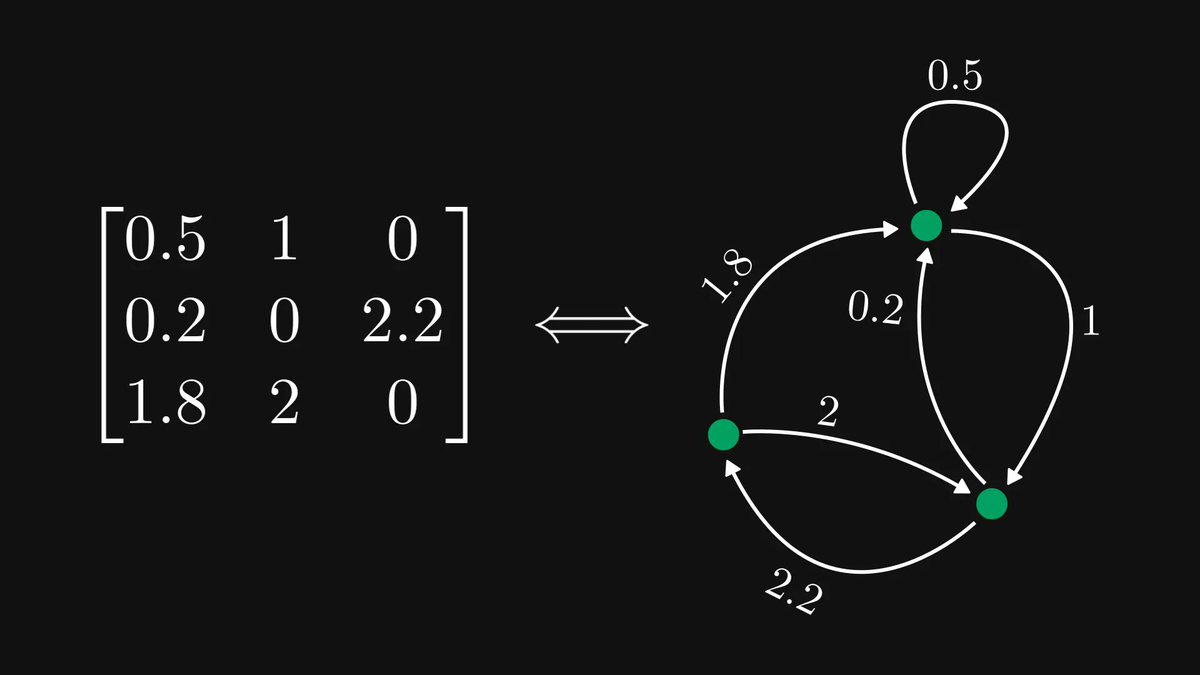
If you looked at the example above, you probably figured out the rule.

Each row is a node, and each element represents a directed and weighted edge. Edges of zero elements are omitted.

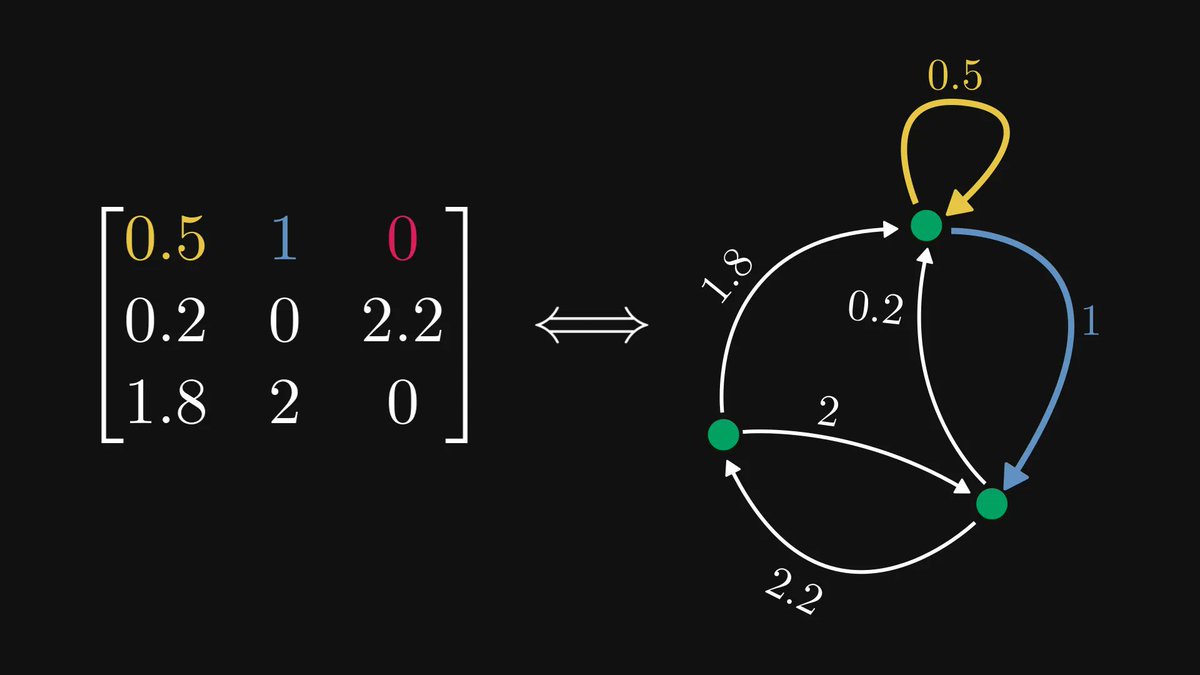
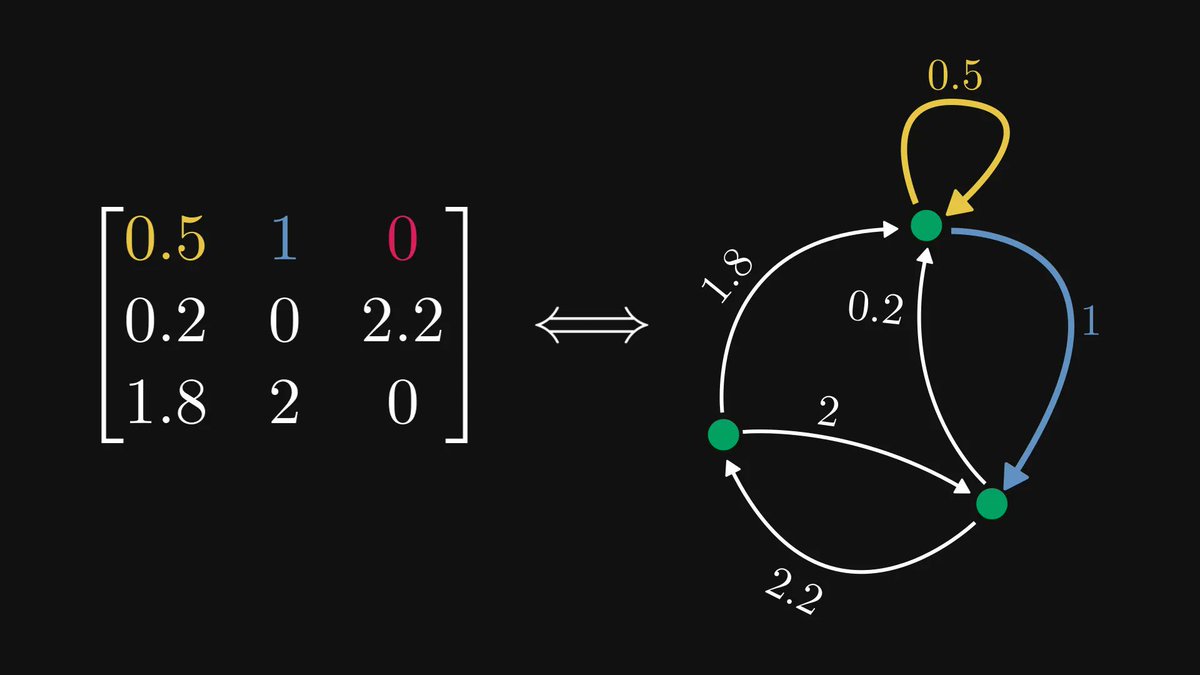
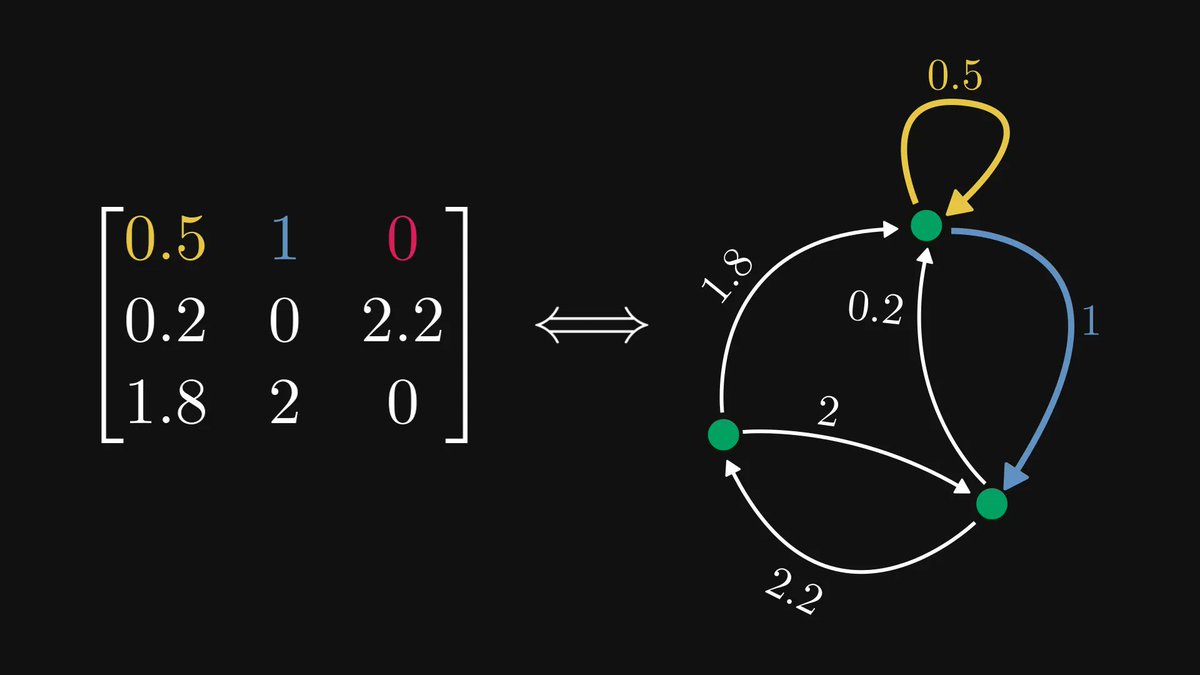
The element in the 𝑖-th row and 𝑗-th column corresponds to an edge going from 𝑖 to 𝑗.
To unwrap the definition a bit, let's check the first row, which corresponds to the edges outgoing from the first node. Image
Read 18 tweets
Jun 30
In calculus, going from a single variable to millions of variables is hard.

Understanding the three main types of functions helps make sense of multivariable calculus.

Surprisingly, they share a deep connection. Let's see why! Image
In general, a function assigns elements of one set to another.

This is too abstract for most engineering applications. Let's zoom in a little! Image
As our measurements are often real numbers, we prefer functions that operate on real vectors or scalars.

There are three categories:

1. vector-scalar,
2. vector-vector,
3. and scalar-vector. Image
Read 16 tweets
Jun 30
Neural networks are stunningly powerful.

This is old news: deep learning is state-of-the-art in many fields, like computer vision and natural language processing. (But not everywhere.)

Why are neural networks so effective? I'll explain. Image
First, let's formulate the classical supervised learning task!

Suppose that we have a dataset D, where xₖ is a data point and yₖ is the ground truth. Image
The task is simply to find a function g(x) for which

• g(xₖ) is approximately yₖ,
• and g(x) is computationally feasible.

To achieve this, we fix a parametrized family of functions. For instance, linear regression uses this function family: Image
Read 19 tweets

Did Thread Reader help you today?

Support us! We are indie developers!


This site is made by just two indie developers on a laptop doing marketing, support and development! Read more about the story.

Become a Premium Member ($3/month or $30/year) and get exclusive features!

Become Premium

Don't want to be a Premium member but still want to support us?

Make a small donation by buying us coffee ($5) or help with server cost ($10)

Donate via Paypal

Or Donate anonymously using crypto!

Ethereum

0xfe58350B80634f60Fa6Dc149a72b4DFbc17D341E copy

Bitcoin

3ATGMxNzCUFzxpMCHL5sWSt4DVtS8UqXpi copy

Thank you for your support!

Follow Us!

:(