Tom Moultrie Profile picture
Dec 15, 2021 21 tweets 7 min read Read on X
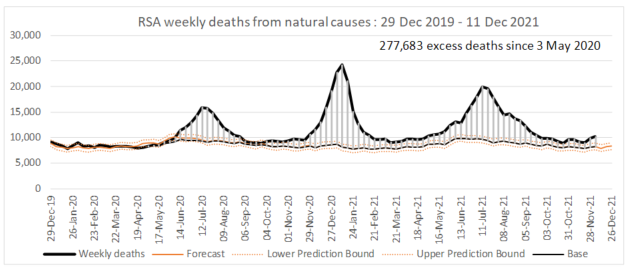
Latest @MRCza and @UCT_news report on excess deaths in South Africa released, covering the period to 11Dec2021. A total of 277 700 excess natural deaths since 3May20. Full report available here: samrc.ac.za/reports/report…
(2/) 1 887 excess natural deaths in the week to 11Dec, up from 1 726 in the preceding week. The p-score this week is 23%, up slightly from 21% the previous week.
(3/) Still no strong excess natural mortality signal from Gauteng or its metros. The p-score in Gauteng in the most recent week is 19% (the fourth lowest of the 9 provinces). Highest in the Eastern Cape (45%) and Mpumalanga (25%).
(4) Some uncertainty re what’s driving the pattern in Eastern Cape.
(5/) p-scores by age have risen slightly for ages 60 and over.
Unnatural deaths have kept uncannily close to the predicted levels for an extended period of time.
(6/) The @nicd_sa released their weekly testing summary today, covering the week to 11Dec2021. The report is available here: nicd.ac.za/diseases-a-z-i….
(7/) Proportions testing positive increased steeply in all provinces, other than Gauteng (which also increased in the week to 11Dec. Nationally, PTP was 35%.
(7b) By age, still testing highest among adolescents and young adults, but has spread to older age groups
(7c) Nationally, the country is shade of Christmas red. More than half of all districts recorded PTP > 30% last week
(8/) BURIED LEDE #1. The proportion testing positive, measured on a daily (as opposed to weekly) basis, has turned in the last few days.
BL#1/2 (This analysis uses only PCR tests (as it is known, see threads passim, that there are delays and problems with loading of antigen results), and split by public-private testing (as known IT problems last week).
BL#1/3 The lower PTP in private is likely due to greater volumes of worried-well testing in private, as well as other selection effects.
(9/) But we can also combine the data from the testing and excess deaths reports, lagging the excess deaths a week behind the testing data.
(10/) BURIED LEDE #2. The pattern in wave 4 is materially different from that in previous waves. A story in 3 graphs
BL#2/2: First. Case and (lagged) excess deaths: in W4, cases have rocketed, but excess deaths? Not so much. Not even in Gauteng.
BL#2/3: Second. Normalised cases and normalised (lagged) excess deaths: in the previous 3 waves, these metrics moved almost perfectly in sync. Not so much. Not even in Gauteng (where cases are > 80% of the peak in W3, yet excess deaths not even 10% of the W3 peak.
BL#2/4: Third. Same plot as the previous, but now presented as a correlation plot between PTP and (lagged) excess deaths. Generally a very stable relationship. Except the red dot for Gauteng, being the most recent week's data.
(11/) OK. So LOTS of people are going to go wild on here shouting about this. Here’s my not-so-hot take. These data are really important. They STRONGLY suggest that the Omicron wave in South Africa will be different.
(12/). But this is NOT definitive proof. We need another week or two data. And this is NOT clinical or virological evidence. And it MAY still be confounded (not least of all by age; we don't think so but still working on that).
(13/) All round the most positive news in weeks. This is cause for optimism. Let's now amass the rest of the data to (hopefully) show that this is all good!
Stay well; stay safe; vaccinate!
(in case clarification required for this and the next few tweets: _IN GAUTENG_; although the figure makes that clear)

• • •

Missing some Tweet in this thread? You can try to force a refresh
 

Keep Current with Tom Moultrie

Tom Moultrie Profile picture

Stay in touch and get notified when new unrolls are available from this author!

Read all threads

This Thread may be Removed Anytime!

PDF

Twitter may remove this content at anytime! Save it as PDF for later use!

Try unrolling a thread yourself!

how to unroll video
  1. Follow @ThreadReaderApp to mention us!

  2. From a Twitter thread mention us with a keyword "unroll"
@threadreaderapp unroll

Practice here first or read more on our help page!

More from @tomtom_m

Dec 14, 2022
Weekly excess deaths in South Africa. A final thread. The report released by the @MRCza and @UCT_news collaboration on excess deaths in South Africa in the week to 10Dec22 was released today. The report is here:samrc.ac.za/reports/report… /1
The report is the last of 138 reports issued weekly since 30Mar20. The first report covered the period to 15Mar20, the second (on 6Apr20) the period to 31Mar20. 39 weekly reports were issued in 2020; 50 in 2021; and 49 in 2022. /2
In addition to providing data in machine readable format since 23Jun20, the collaboration has produced many technical notes, methodological reports, and explainers. /3
Read 23 tweets
Dec 9, 2022
Apologies for the delay in the weekly deaths and testing summaries - reports from @MRCza and @nicd_sa now released! (Delay due to late release of testing data).
In the week to 3Dec22, 450 excess natural deaths were recorded, bringing the total since 3May20 to 338 300.
The report is available here: The excess deaths report is here: samrc.ac.za/reports/report…. In the week to 3Dec22, natural deaths were 5.6% above expected, ranging from -7.6% in NC to 15.1% in EC.
As can be seen, little signal (and quite a lot of noise) in the data for some time now. Unnatural deaths continue to follow the expected patterns and levels
Read 6 tweets
Jul 27, 2022
Latest weekly @MRCza and @UCT_news report on excess deaths in South Africa released. 801 excess natural deaths in the week to 23Jul22; 326 000 since 3May20. Report here: samrc.ac.za/reports/report…
Observed natural deaths for the week were 8.7% above that expected, very slightly higher than the upper prediction bound. Provincially, p-scores range from 1.8% in NW to 24.5% in NC. (only NC and EC - 20.3% -) exceed 10% above expected.
Excess deaths are low in (almost) every age group, are negligible in and are at much lower levels than in previous waves of infection. p-scores in every age group are less than 25%,and are negative between ages 20 and 59.
Read 6 tweets
Jul 20, 2022
Latest @MRCza and @UCT_News report on excess deaths in South Africa released. Issues in the data received from Home Affairs have led to a caution being issued with this week's data. Report here: samrc.ac.za/reports/report…
325k excess deaths between 3May20 and 16Jul22. While the increment in the week to 16Jul22 is low, the caution above should be borne in mind and results should not be over-interpreted; the correction will come through in due course.
Natural deaths in the week were 4.8% higher than expected (see caveat), ranging from -13.5% (NW) to +23.8% (NC).
Read 7 tweets
Jul 13, 2022
Latest @MRCza and @UCT_news report on excess deaths in South Africa is out; covering the week to 9Jul22. 325k excess natural deaths since 3May20; 1100 in the most recent week. Report here: samrc.ac.za/reports/report…
Excess natural deaths of those under age 60 back to the predicted levels; those over 60 still somewhat above. Nationally, natural deaths were 12.0% above expected with most provinces close to or within the prediction range.
The p-score by age band shows that excess mortality concentrated in those aged 60+. (The odd pattern of those under 5 may reflect an earlier RSV season than anticipated, with excess mortality in past months, now reverting to baseline).
Read 7 tweets
Jun 29, 2022
Latest @MRCza and @UCT_news report on excess deaths in South Africa, covering the week to 25Jun22, released. 322419 excess natural deaths since 3May20, 1112 in the week to 25June22, the lowest since 3-9April22. Report --> samrc.ac.za/reports/report…
Natural deaths in the week to 25Jun22 were 11.6% above expected, ranging from 20.1% in KZN to -3.4% in the Western Cape.
Unnatural deaths continue to stick closely to the expected numbers.
Read 7 tweets

Did Thread Reader help you today?

Support us! We are indie developers!


This site is made by just two indie developers on a laptop doing marketing, support and development! Read more about the story.

Become a Premium Member ($3/month or $30/year) and get exclusive features!

Become Premium

Don't want to be a Premium member but still want to support us?

Make a small donation by buying us coffee ($5) or help with server cost ($10)

Donate via Paypal

Or Donate anonymously using crypto!

Ethereum

0xfe58350B80634f60Fa6Dc149a72b4DFbc17D341E copy

Bitcoin

3ATGMxNzCUFzxpMCHL5sWSt4DVtS8UqXpi copy

Thank you for your support!

Follow Us!

:(