
Professor of Demography at UCapeTown. Not posting again here. Follow at @tom-moultrie.bsky.social


 The report is available here: The excess deaths report is here: samrc.ac.za/reports/report…. In the week to 3Dec22, natural deaths were 5.6% above expected, ranging from -7.6% in NC to 15.1% in EC.


 Observed natural deaths for the week were 8.7% above that expected, very slightly higher than the upper prediction bound. Provincially, p-scores range from 1.8% in NW to 24.5% in NC. (only NC and EC - 20.3% -) exceed 10% above expected.
 325k excess deaths between 3May20 and 16Jul22. While the increment in the week to 16Jul22 is low, the caution above should be borne in mind and results should not be over-interpreted; the correction will come through in due course.


 Excess natural deaths of those under age 60 back to the predicted levels; those over 60 still somewhat above. Nationally, natural deaths were 12.0% above expected with most provinces close to or within the prediction range.

 Natural deaths in the week to 25Jun22 were 11.6% above expected, ranging from 20.1% in KZN to -3.4% in the Western Cape.

 Natural deaths in the week were 15.2% above expected ranging from 7.0% in Limpopo to 43.5% in NC - but small numbers, and some uncertainty given the adjustment for the public holiday over the week.

 Nationally, excess natural deaths were 12.5% above expected in the week to 4Jun22, ranging from 4.1% in the EC to 27.3% in the NC. [EC deaths seem low, especially in NMB. Reporting problems?] But still seems that excess deaths have turned in the latest week.


 Excess natural deaths in the week 22.5% above expected nationally, ranging from 10.5% in WC to 36% in FS. National figure is still approximately half that of the peak in W4.
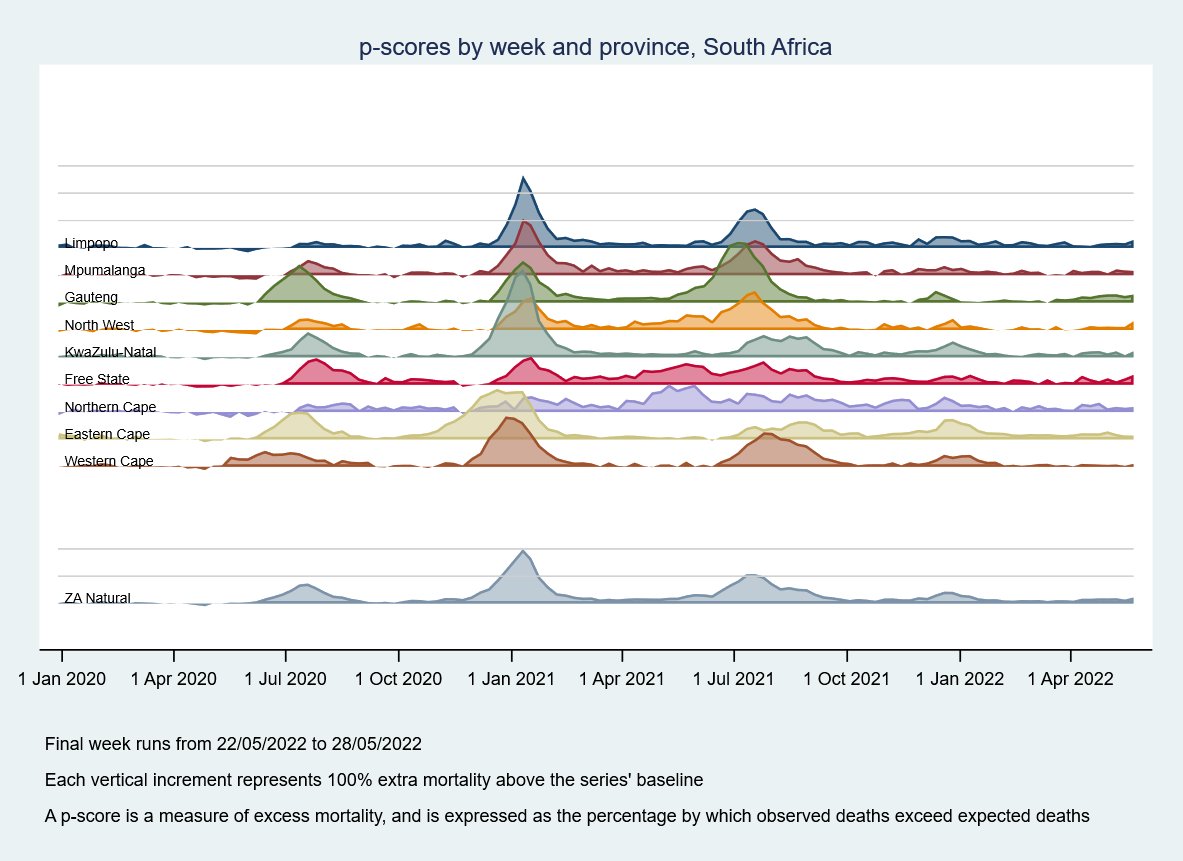


 Nationally, natural deaths were 20.% above expected, tranging from 11.0% in KZN to 30.1% in Gauteng. Reported deaths - and their reporting!- however, seem to have stalled (no deaths reported in MP since 9Mar22; none in LM since 5May22).


 Excess deaths *slowly* increasing above the baseline, with deaths among people aged 60+ above the upper prediction interval, while those among people aged under 60 are nearing the upper prediction interval.

 In the week to 7May22, the national natural deaths p-score was 18%; ranging from 4.2% in the WC to 36.9% in the EC.


 The public holidays on 27Apr and 2May make the reporting of estimation of excess deaths in the week to 30Apr22 somewhat more imprecise. On top of that, system problems in the Eastern Cape since mid-April might account for the somewhat odd pattern observed there.


 The report is available here: samrc.ac.za/reports/report…. Excess natural mortality in the week was 12.5%.


 Natural deaths among those <60 remain within the prediction interval; those >60 slightly above the prediction interval. Nationally, the excess natural mortality p-score was 9.2% (last week 10.4%).


 Excess natural deaths under the age of 60 remain within the prediction interval. Deaths above 60 remain close to the upper limit of the prediction interval. Nationally, natural mortality in the week was 14% above expected; ranging from 3.3% in Mpumalanga to 23% in Northern Cape.

 Weekly p-score is 11.3%, a level unchanged for the last three weeks. p-scores fell in most provinces. The increase in the FS should not be over-interpreted, as the public holiday on 21Mar would have affected registrations of deaths in the week to 19Mar

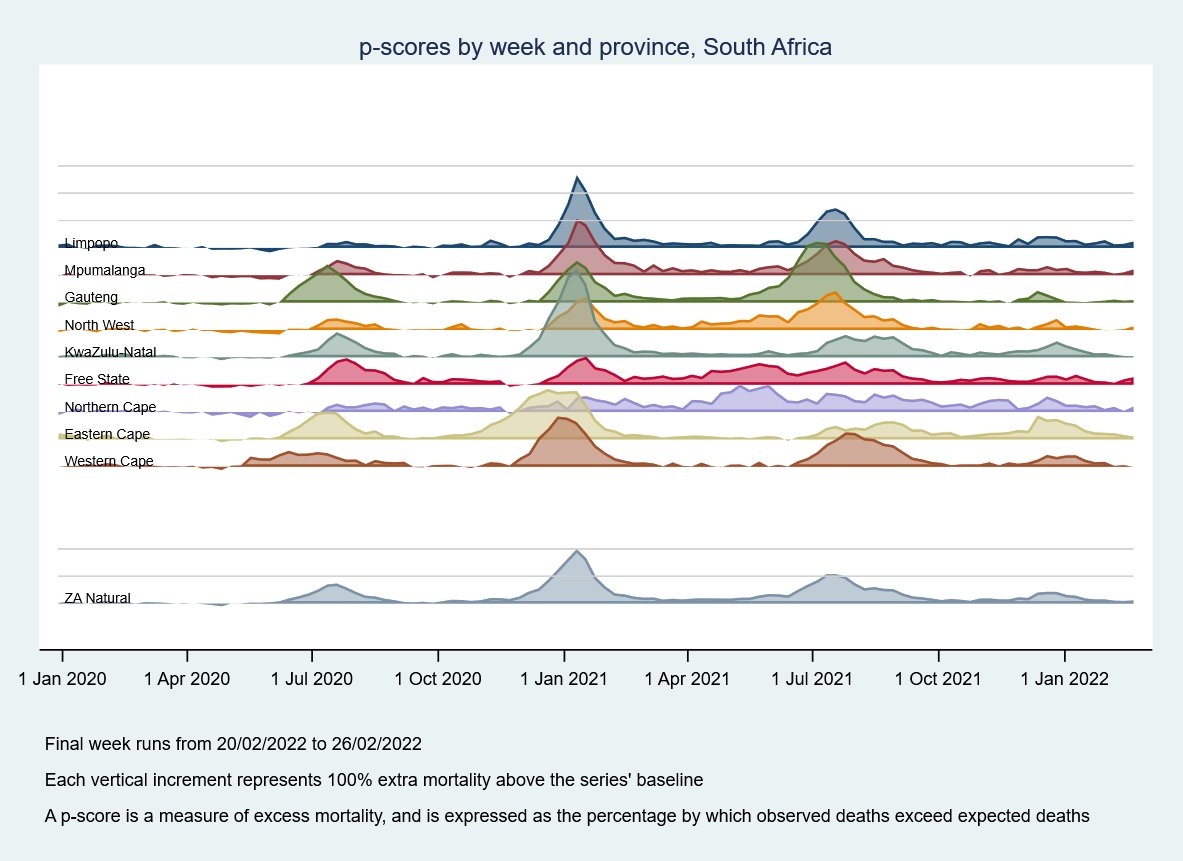
 Natural excess deaths in the week to 26Feb22, were 898. The p-score for the week was 11.9% (up marginally from 9.8% the previous week). The province with the highest p-score is Free State (27.1%, up from 20.1%); the lowest is WC (-0.4%, down from 6.2%).

 Natural deaths in the week were 14% above expected; ranging from 1.6% in NW to 26.1% in FS.