Suomen epidemia 16.12.2021: ilmaantuvuus on lähtenyt äkkijyrkkään nousuun Keski-Suomessa (tänään 13.7% päivässä = 48x kuukaudessa) ja Pohjois-Pohjanmaalla (tänään 16% päivässä = 96x kuukaudessa). HUS:n alueella ilmaantuvuus nousi tänään 9.8% = 17x kuukaudessa.
1/x
1/x

Tänään THL ilmoitti 1981 tartuntaa, poisti 0, ja raportoinnin viive kasvoi 84 tartunnan verran. Muuttumattomalla viiveellä laskettu (eli sairaanhoitopiirien lukuihin perustuva) uusien tartuntojen määrä on 1981+0+84 = 2065 (punainen viiva).
2/x
2/x

Testien määrä ei näytä kasvaneen lainkaan yli viikkoon. Veikkaan että lukuja puuttuu (Fimlab raportoi tänään vakavasta tietojärjestelmäviasta) eli että tilanne on parempi kuin miltä se näyttää.
3/x
3/x

Samasta syystä voi olla, että kuvassa näkyvä positiivisten osuuden nousu ei ole todellisuudessa ehkä ihan näin nopea. Jos on, niin tällä vauhdilla (3.3% päivässä 6.12.--) positiivisten osuus 2.6 -kertaistuu kuukaudessa. Etelä-Afrikassa Omicron nosti positiivisten osuuden 25x.
4/x
4/x

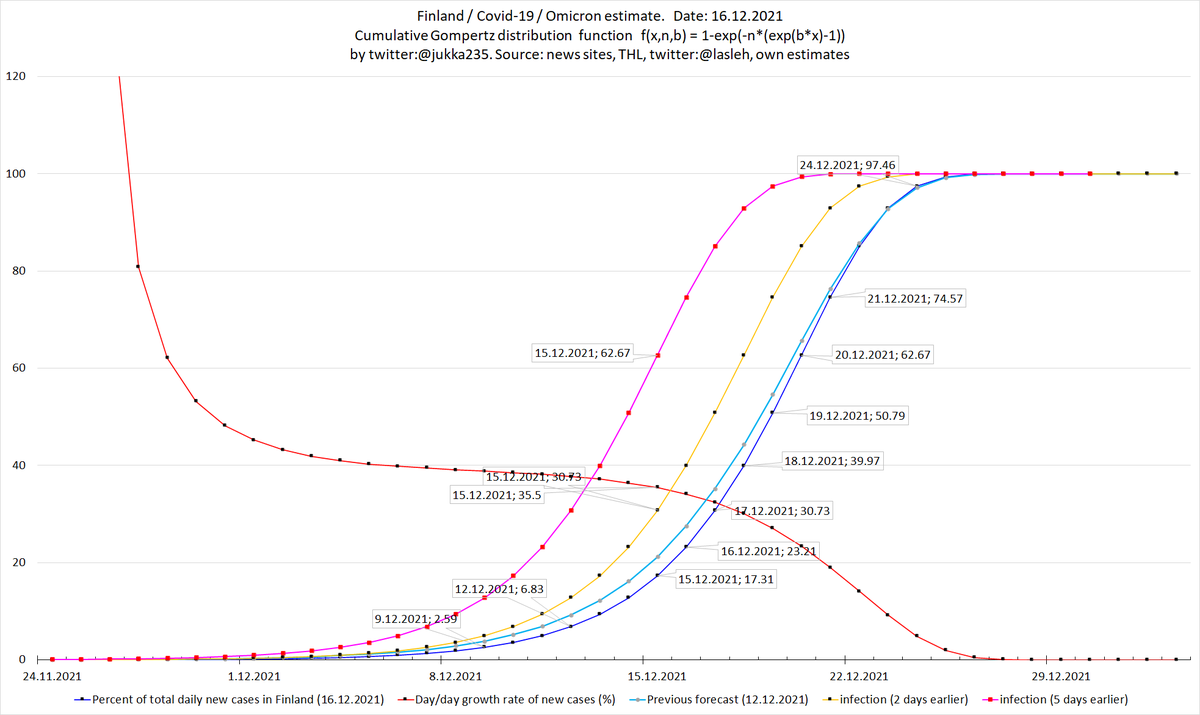
Kaksi viikkoa (19.11.-6.12.) kestänyt todellisten tartuntojen kasvun hidastuminen on ohi. Arvioitu todellisten tartuntojen päivittäinen määrä on 6.12. jälkeen kasvanut 7.7 prosenttia päivässä = 9.2x kuukaudessa.
5/x
5/x

Omicron-ennuste on noussut hieman eilisestä, mutta on hieman alempana kuin ensimmäinen 12.12. tehty ennuste. Arvioin, että HUS:n alueella Omicronin osuus tartunnoista nousee hieman nopeammin kuin Kööpenhaminan alueella: saman päivän luvut ovat noin 3-5 %-yksikköä ylempänä.
6/x
6/x
HUS:n alueella 7 päivän ilmaantuvuus nousee nopeasti. Aikavälillä 8.12.-13.12. kasvu oli 5.6% päivässä = 5.1x kuukaudessa, mutta viimeisen päivän aikana (12.12.-13.12.) kasvu oli 9.8% = 16.7x kuukaudessa. Omicronin osuus oli 13.12. noin 17% tartunnoista.
7/x
7/x

Helsingissä ilmaantuvuus on 12.12. jälkeen noussut uskomattomat 46%, eli 10.0% päivässä = 17x kuukaudessa. Helsingin osuus koko maan tartunnoista on laskenut koko syksyn ajan, mutta lähti nousemaan 30.11. jälkeen.
8/x
8/x

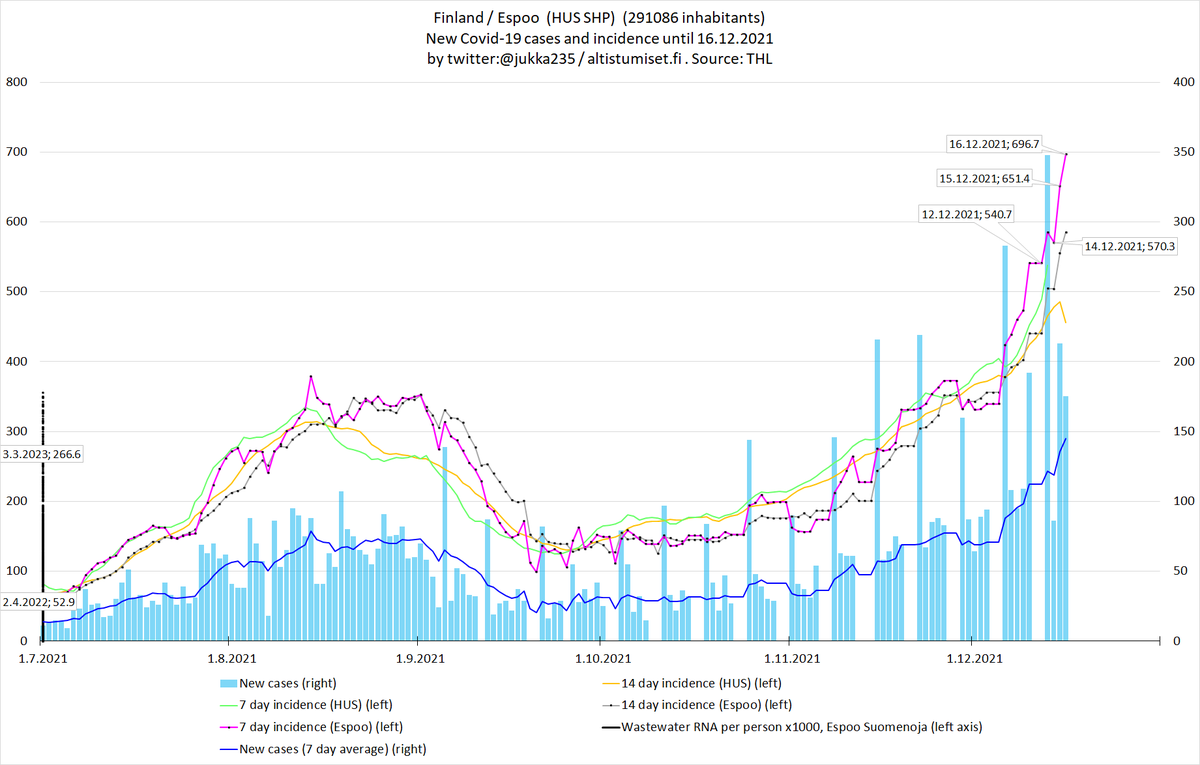
Espoossa ilmaantuvuus on 14.12. jälkeen noussut 10.5 prosenttia päivässä = 20x kuukaudessa. Nämä kuntien luvut kuvaavat tilannetta noin 3-4 päivää aikaisemmin, eli tällä kasvuvauhdilla todellinen ilmaantuvuus 16.12. on power(1.105,4)= 35-49 prosenttia korkeampi kuin kuvassa.
9/x
9/x
Vantaalla ilmaantuvuus on 14.12. jälkeen noussut 9.9 prosenttia päivässä = 16.9x kuukaudessa, ja todellinen ilmaantuvuus 16.12. on 33-46 prosenttia korkeampi.
10/x
10/x

Varsinais-Suomessa 7 päivän ilmaantuvuus nousi 19 prosenttia tänään. 14 päivän ilmaantuvuus ei kuitenkaan ole noussut, eli kyse voi olla siitä että tartuntoja raportoitiin myöhässä.
11/x
11/x

Satakunnassa ilmaantuvuus on 5.12. jälkeen kasvanut 8.8 prosenttia päivässä = 12.6x kuukaudessa. Myös 14 päivän ilmaantuvuus nousee nopeasti.
12/x
12/x

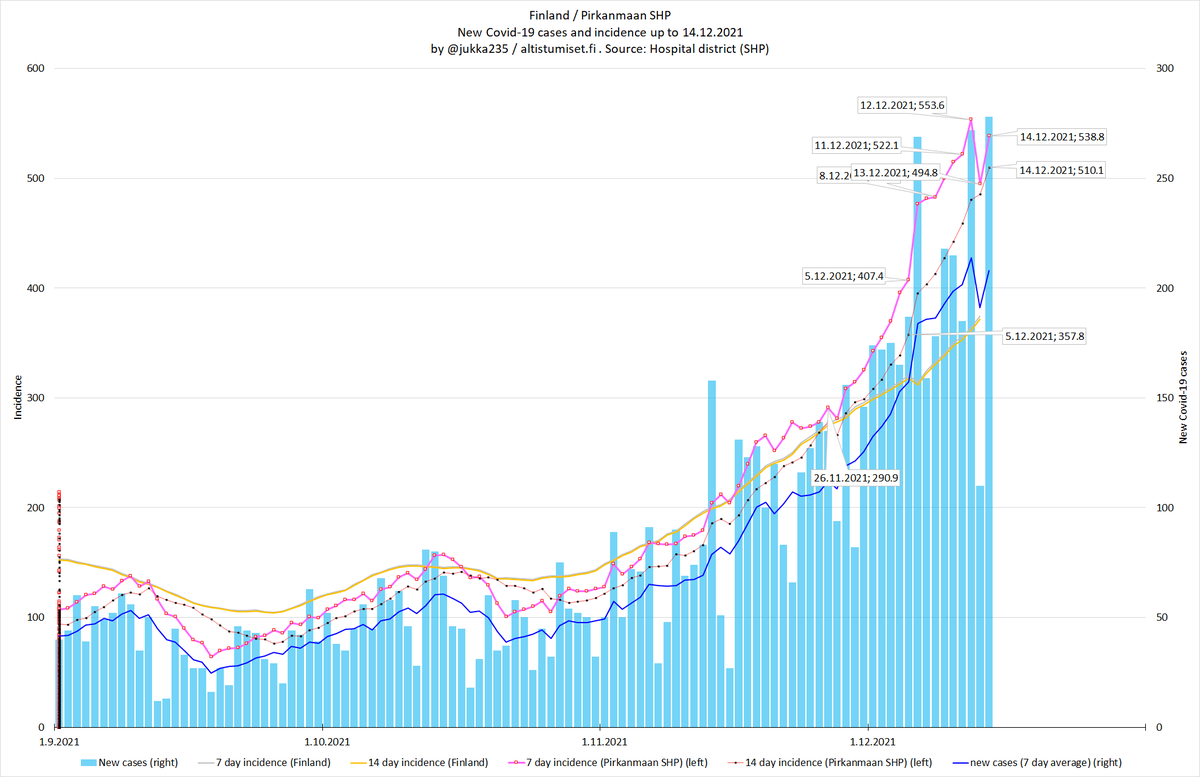
Pirkanmaalla 14 päivän ilmaantuvuus on 5.12. jälkeen noussut 3.2 prosenttia päivässä = 2.5x kuukaudessa. Kasvu saattaa todellisuudessa olla kovempaa (Fimlabin ongelmat).
13/x
13/x
Päijät-Hämeessä kasvu on suorastaan vaatimatonta: 5.12. jälkeen ilmaantuvuus on kasvanut 1.6 prosenttia päivässä = 1.6x kuukaudessa.
14/x
14/x

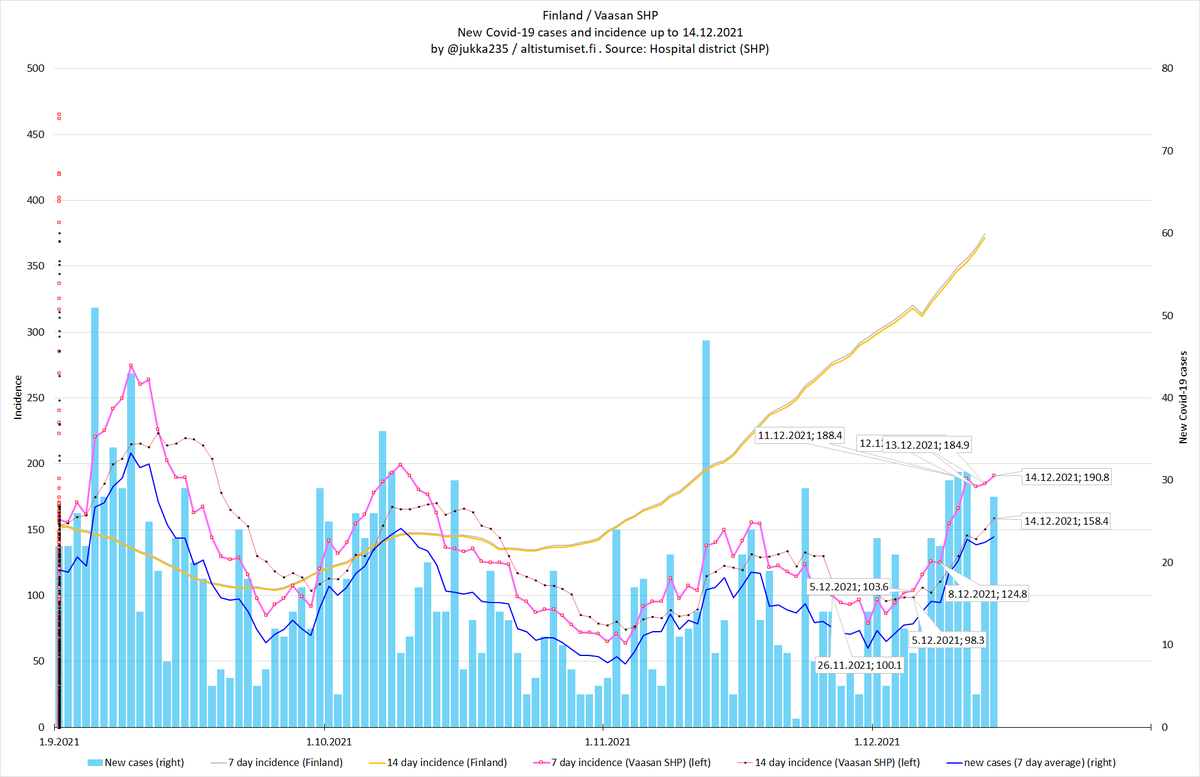
Vaasassa ilmaantuvuus ei ole viimeisten kolmen päivän aikana kasvanut lainkaan.
15/x
15/x
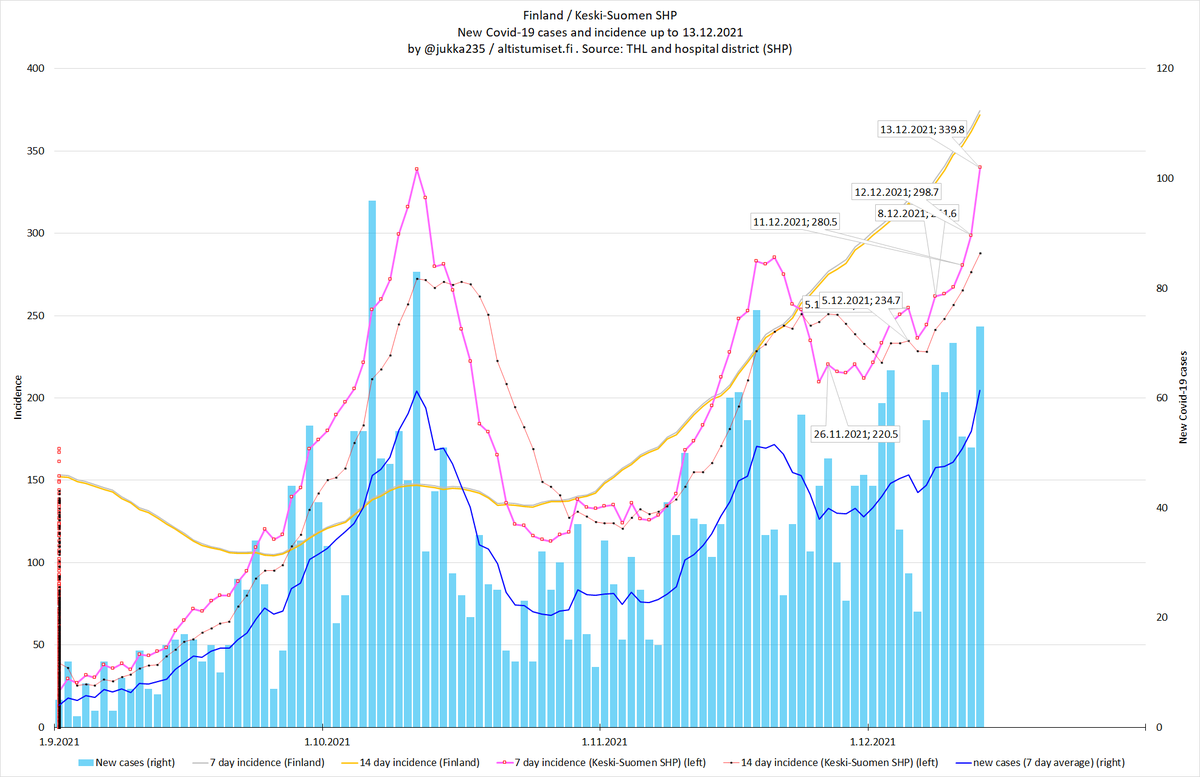
Keski-Suomessa on alkanut voimakas tartuntojen kasvu. 6.12. jälkeen kasvuvauhti on ollut 5.3% päivässä = 4.7x kuukaudessa, mutta viimeisenä päivänä (12.12.-13.12.) kasvu oli 13.7% = 48x kuukaudessa. Keski-Suomi mainittiin STM/THL 16.12. tilannekatsauksessa erikseen.
16/x
16/x
Keski-Pohjanmaalla saatiin marraskuun alun paha tilanne hallintaan. Kasvu alkoi kuitenkin uudestaan 9.12., ja viimeisen kahden päivän aikana (12.12.-14.12.) kasvu on ollut 27 prosenttia päivässä = 1400x kuukaudessa.
17/x
17/x

Kokkolassa ilmaantuvuus on 12.12. jälkeen kasvanut 52.8 prosenttia päivässä = 19x viikossa = power(1.528,30) = 333000x kuukaudessa.
18/x
18/x

Raahessa ilmaantuvuus on 12.12. jälkeen kasvanut 13.1 prosenttia päivässä = 40x kuukaudessa.
19/x
19/x

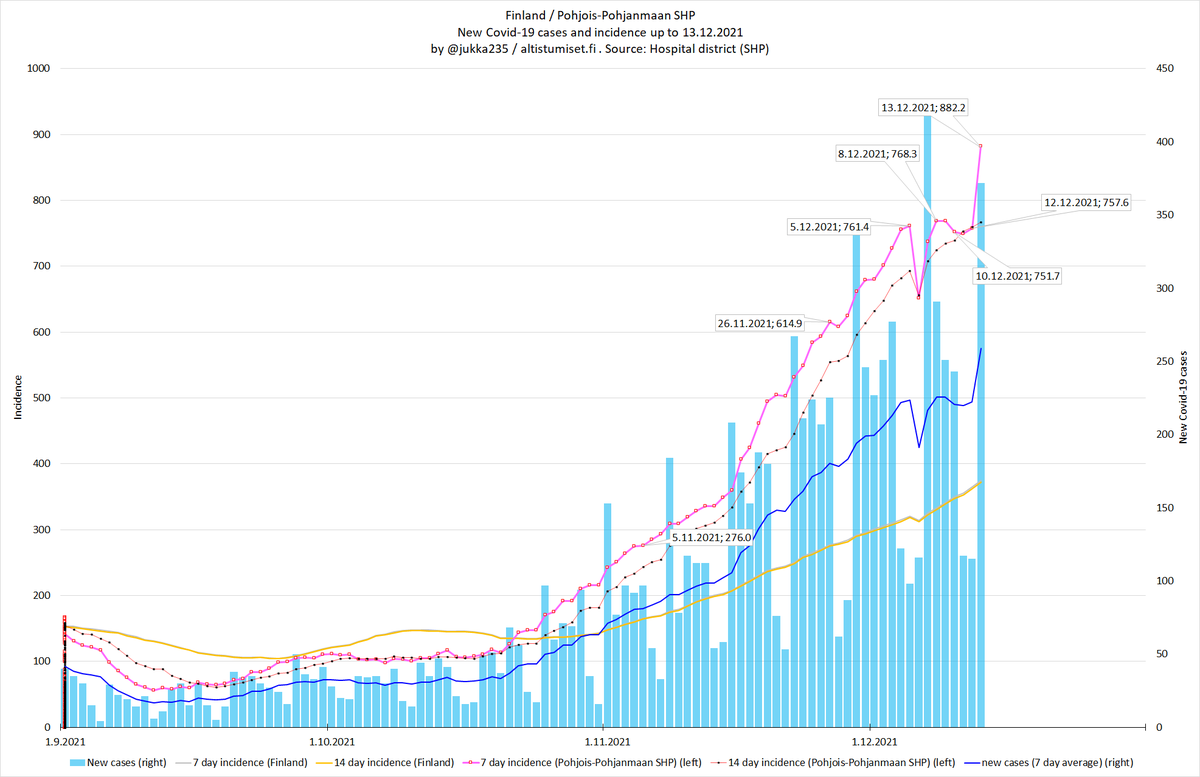
Sen sijaan Pohjois-Pohjanmaalla 7 päivän ilmaantuvuudessa tapahtunut nousu saattaa selittyä myöhässä raportoiduilla tartunnoilla, sillä 14 päivän ilmaantuvuus ei noussut samalla tavalla voimakkaasti tänään.
20/x
20/x
OYS erityisvastuualueella ilmaantuvuus nousee kaikkialla muualla, paitsi ei Kainuussa.
21/x
21/x

Omicron hospital admissions in Denmark (percent of new cases) as a function of the delay from PCR test to hospital admission.
22/x
22/x

Notes (1)
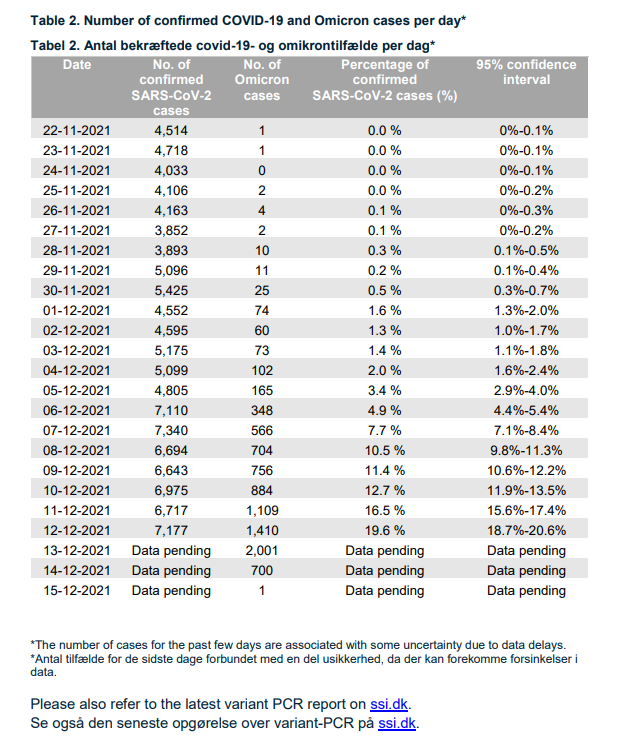
- this is the table from SSI daily reports I am using
- there appears to be variance for the date of this table with respect to the date of the report. I have assumed the data is up to (publish date -1).
23/x
- this is the table from SSI daily reports I am using
- there appears to be variance for the date of this table with respect to the date of the report. I have assumed the data is up to (publish date -1).
23/x

Notes (2)
- I am using the new case counts from Table 2 (below) and not from table 6. The reason is that there appears to be delay in new case counts.
24/x
- I am using the new case counts from Table 2 (below) and not from table 6. The reason is that there appears to be delay in new case counts.
24/x
Notes (3)
- I have included both
(1) Omicron cases tested positive <= 48 hours after admission and
(2) Omicron cases tested positive >48 hours after admission.
25/x
- I have included both
(1) Omicron cases tested positive <= 48 hours after admission and
(2) Omicron cases tested positive >48 hours after admission.
25/x

Notes (4)
- which patients to include: I have taken Table 6 "as is" from SSI.
- this graph is for admissions only. I'll do people in hospital next
26/x
- which patients to include: I have taken Table 6 "as is" from SSI.
- this graph is for admissions only. I'll do people in hospital next
26/x
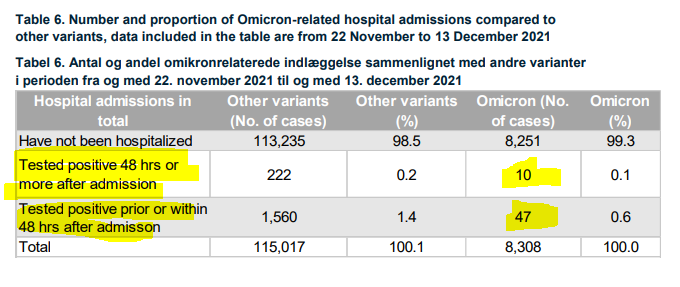
Notes (5)
- this graph gives one half of the answer re how severe Omicron is
- we need information on the amount of time from PCR test to admission (see below) to know the result
- the answer is unknown until then
27/x
- this graph gives one half of the answer re how severe Omicron is
- we need information on the amount of time from PCR test to admission (see below) to know the result
- the answer is unknown until then
27/x
https://twitter.com/dgurdasani1/status/1471620434038861839
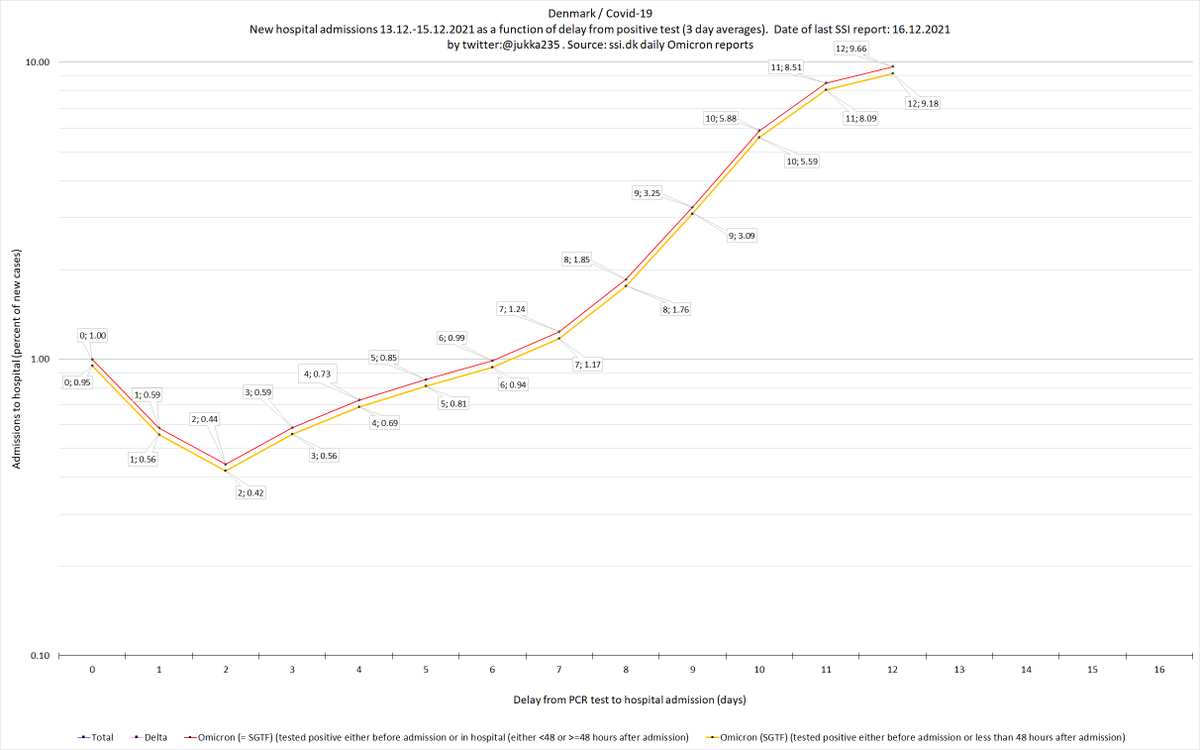
Omicron hospital admissions in Denmark (percent of new cases) as a function of the delay from PCR test to hospital admission.
Note: I have separated admissions tested positive prior or <=48 hours after admission from total admissions.
28/x
Note: I have separated admissions tested positive prior or <=48 hours after admission from total admissions.
28/x

Notes (1)
1) Y-axis is hospital admissions (as percentage of new cases)
2) X-axis is the amount of time from PCR test to hospital admission
3) what we don't know yet is how many days it actually takes before a person with Omicron gets hospitalised.
29/x
1) Y-axis is hospital admissions (as percentage of new cases)
2) X-axis is the amount of time from PCR test to hospital admission
3) what we don't know yet is how many days it actually takes before a person with Omicron gets hospitalised.
29/x
https://twitter.com/dgurdasani1/status/1471620434038861839
How to read this graph: if it takes e.g. 7 days on average from PCR test to hospital admission (and we don't know yet how many days it actually takes), then (and ONLY then) 1.17% of those people were hospitalised.
30/x
30/x
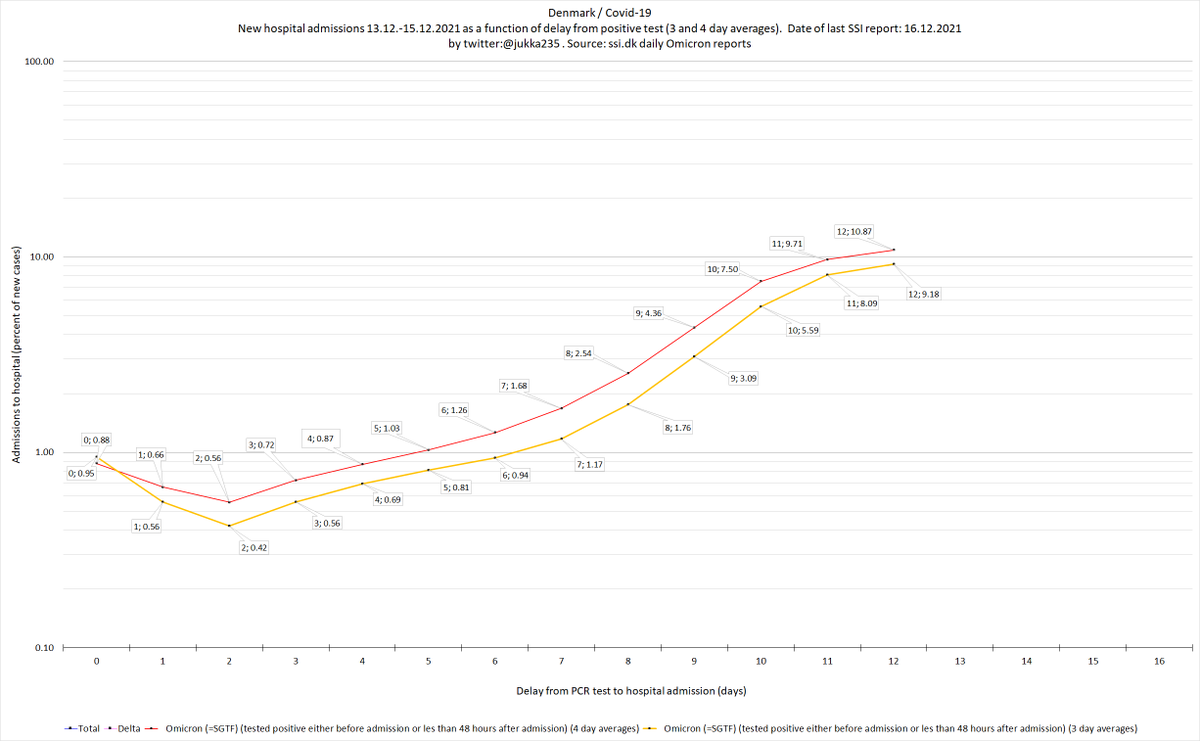
Here is the graph calculated using 3 and 4 day averages. It looks that using averages skews the result somewhat, and therefore the true Omicron hospital admission levels in Denmark are likely to be somewhat lower.
31/x
31/x
• • •
Missing some Tweet in this thread? You can try to
force a refresh