484 #sqlserver batch mode on rowstore queries. DOP 8. run consecutively by a single session. each query is a fullscan of a different single table, grouping by a CASE statement on a non-indexed INT/BIGINT/NUMERIC data type column. producing one or two result rows of 1 column each. 

based on observation of the first experiment with these queries, in which the queries were ordered alphabetically by the name of the only table in the FROM, i reordered the queries based on decreasing pages:rows ratio. that gives the evident decreasing pages/sec trend :-)
a closeup of the first 10 minutes shows the considerable variation even though the downward trend is evident.

those are some sharp peaks and valleys.
but for the 5 second capture interval (i usually use 30 seconds) i'd have missed it.
but for the 5 second capture interval (i usually use 30 seconds) i'd have missed it.
https://twitter.com/sqL_handLe/status/1471841541668978693?s=20
Yesterday i had a solid theory about the cause for the variation. No kidding; when i woke up today i couldn't remember it 😂😂😂
i remembered my theory about 10 minutes after remembering i had a theory 😂🤣🙃
i think it's htbuild/htdelete waits.
i think it's htbuild/htdelete waits.
if there's no corrrelation between CPU utilization and page reads/sec i have to let that theory go.
if there *is* a correlation... still doesn't mean i'm right.
if there *is* a correlation... still doesn't mean i'm right.
do you see what i see?
LoL
my theory lives on for now.
LoL
my theory lives on for now.

this is a *super* important graph and i'll hafta try to explain why later.
i just had a super-scaling idea that needs to stay top-secret for now. maybe i'll send myself a dm so i remember it.
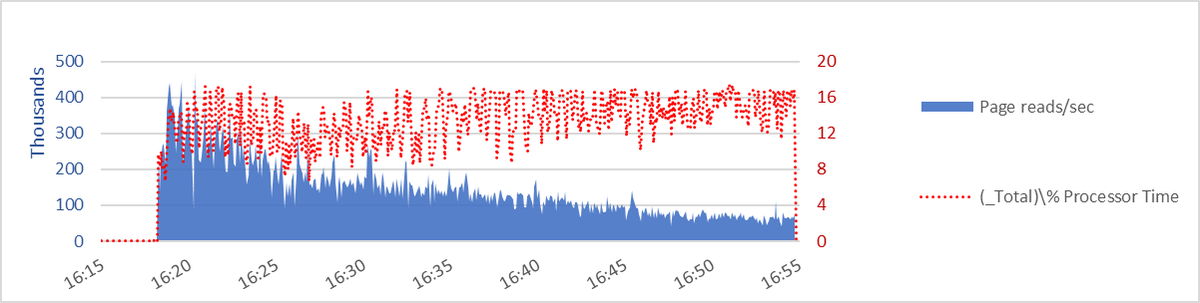
talk a little about this graph with pages/sec in blue area and cpu utilization as the red dotted line.
48 vcpu system. so, for the DOP 8 BMoR 8/48 = 1/6 ~ 16.6% is the max cpu utilization.
48 vcpu system. so, for the DOP 8 BMoR 8/48 = 1/6 ~ 16.6% is the max cpu utilization.

what about execution context ID 0 for the DOP 8 queries? doesn't that make max cpu utilization higher than 8/48 = 16.6%, since there are 9 worker threads for the dop 8 queries?
Nope. Placement of the execution context ID 0 thread relative to the parallel workers isn't pre-determined on this 48 vcpu system. it might be on one of the 8 schedulers that also have a parallel worker for the query.
in which case it doesn't matter *what* ecid 0 does; 16.6% max.
in which case it doesn't matter *what* ecid 0 does; 16.6% max.
*if* ecid 0 is on a different scheduler than any of the 8 parallel workers in a DOP 8 query with a single zone (this will commonly be the case on a 48 vcpu vm), then the questions are:
1) what does ecid 0 do
2) *when* does ecid 0 do it relative to work of the 8 parallel workers
1) what does ecid 0 do
2) *when* does ecid 0 do it relative to work of the 8 parallel workers
what does ecid 0 do?
in these queries, ecid 0 compiles the plan, sends results to the client, and takes care of housekeeping to go from one table/query to the next.
in these queries, ecid 0 compiles the plan, sends results to the client, and takes care of housekeeping to go from one table/query to the next.
compiling the plan takes place when there *are* no parallel workers for that ecid 0. so does the housekeeping to go from one table/query to the next.
there are only up to 2 result rows from this aggregation query - a single BIGINT column in each row.
so sending results to the client - which happens at the end of the parallel processing - is a minimal task.
so sending results to the client - which happens at the end of the parallel processing - is a minimal task.
so... 16.6% CPU utilization is the maximum CPU consumption for these DOP 8 queries on this 48 vcpu vm.
a shortcut to showing that the valleys in pages/sec is largely due to waits (rather than a varying pace of work per % CPU utilized) is to "normalize" or "embiggen" the pages/sec number to its value if CPU were at 16.6% at the time.
dang it.
whaddya say now, smartie pants?
it was a solid idea. And it smooths the curve a bit.
i was hoping for more.
you know. something amazing, i guess.
this means there's at least one other contributor to the curve, other than waits.
whaddya say now, smartie pants?
it was a solid idea. And it smooths the curve a bit.
i was hoping for more.
you know. something amazing, i guess.
this means there's at least one other contributor to the curve, other than waits.

maybe 484 plan compiles and housekeeping at irregular points along the way in ~37 minutes was a bigger confounding variable than i expected.
power runs at DOP 12 and DOP 4, with graphs adjusting page reads/sec to 25% CPU utilized and 8.3%, compared to what i have at DOP 8, may indicate how much the DOP 1 "nonquery processing" work confounds the results.
as a minor consolation to myself and sign of the progress i've made understanding what's happening so far, here is #sqlserver page reads/s vs cpu utilation.
the top graph is the same 484 queries, in alpabet order of their table names.
bottom graph, sorted by pages:rows ratio.
the top graph is the same 484 queries, in alpabet order of their table names.
bottom graph, sorted by pages:rows ratio.
![both graphs have [page reads/s] in blue area graph, against](https://pbs.twimg.com/media/FG0syyJXIAIgYR4.png)
there's something happening here
what it is ain't exactly clear...
what it is ain't exactly clear...
if i were to run two sessions at a time with DOP 8 queries, with the goal of getting through this list of 484 queries as fast as possible, this is how I'd do it.
one session starts at the high end of the pages:rows ratio, the other session starts at the low end; meet in middle.
one session starts at the high end of the pages:rows ratio, the other session starts at the low end; meet in middle.

*at least one other contributor to /variance from/ the curve, other than waits.
the sole contributor to the curve is pages:rows ratio, since the plan for every query is the same.
the sole contributor to the curve is pages:rows ratio, since the plan for every query is the same.
• • •
Missing some Tweet in this thread? You can try to
force a refresh