How to evaluate your ML model? 📏
Your accuracy is 97%, so this is pretty good, right? Right? No! ❌
Just looking at the model accuracy is not enough. Let me tell you about some other metrics:
▪️ Recall
▪️ Precision
▪️ F1 score
▪️ Confusion matrix
Let's go 👇
#RepostFriday
Your accuracy is 97%, so this is pretty good, right? Right? No! ❌
Just looking at the model accuracy is not enough. Let me tell you about some other metrics:
▪️ Recall
▪️ Precision
▪️ F1 score
▪️ Confusion matrix
Let's go 👇
#RepostFriday
We'll use this example in the whole thread - classifying traffic light colors (e.g. for a self-driving car).
Yellow traffic lights appear much less often, so our dataset may look like this.
This means our model could reach 97% accuracy, by ignoring all 🟡 lights. Not good!
👇
Yellow traffic lights appear much less often, so our dataset may look like this.
This means our model could reach 97% accuracy, by ignoring all 🟡 lights. Not good!
👇

Let's assume now that we trained our model and we get the following predictions.
Do you think this model is good? How can we quantitatively evaluate its performance? How should it be improved?
Let's first discuss the possible error types 👇
Do you think this model is good? How can we quantitatively evaluate its performance? How should it be improved?
Let's first discuss the possible error types 👇

Let's evaluate how well our model classifies 🟡 lights. There are 3 possible cases:
✅ True Positive - our model correctly classifies the 🟡
❌ False Negative - our model classifies 🟡 as another color
❌ False Positive - our model classifies another color as 🟡
👇
✅ True Positive - our model correctly classifies the 🟡
❌ False Negative - our model classifies 🟡 as another color
❌ False Positive - our model classifies another color as 🟡
👇

Accuracy
We can now just take the percentage of correctly classified samples - this is called the accuracy. In this case, it is 75%.
What is the problem? 🤔
We have no idea in which cases the model has problems and needs to be improved.
We need to look at other metrics 👇
We can now just take the percentage of correctly classified samples - this is called the accuracy. In this case, it is 75%.
What is the problem? 🤔
We have no idea in which cases the model has problems and needs to be improved.
We need to look at other metrics 👇

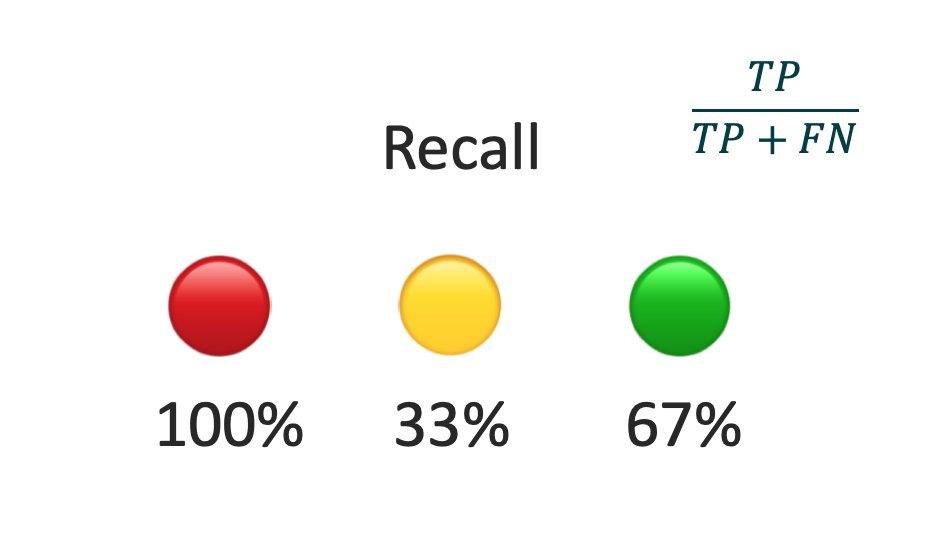
Recall
The recall is computed separately for each color as the percentage of samples of the color classified correctly (per class accuracy).
We now see that we have a big problem with 🟡 and we should also improve 🟢.
On the other hand 🔴 looks perfect. But it isn't... 👇
The recall is computed separately for each color as the percentage of samples of the color classified correctly (per class accuracy).
We now see that we have a big problem with 🟡 and we should also improve 🟢.
On the other hand 🔴 looks perfect. But it isn't... 👇
Precision
The precision tells us how many of the model's predictions for a certain class were correct. The precision for 🔴 is low because the model wrongly classifies 🟢 and 🟡 lights as 🔴.
The 🟢 looks much better, while 🟡 is bad again.
Now, let's combine both 👇
The precision tells us how many of the model's predictions for a certain class were correct. The precision for 🔴 is low because the model wrongly classifies 🟢 and 🟡 lights as 🔴.
The 🟢 looks much better, while 🟡 is bad again.
Now, let's combine both 👇

F1 Score
The problem with Recall is that it ignores False Positives (FPs), while Precision ignores False Negatives. The F1 score is another metric that considers both.
We can see that 🟡 is indeed quite bad, but we also see that both 🔴 and 🟢 need to be improved.
👇
The problem with Recall is that it ignores False Positives (FPs), while Precision ignores False Negatives. The F1 score is another metric that considers both.
We can see that 🟡 is indeed quite bad, but we also see that both 🔴 and 🟢 need to be improved.
👇

Confusion Matrix
We can also get an overview of both FPs and FNs by looking at the Confusion Matrix. It breaks down for each class, how it was classified.
For example, looking at the 🟡 row, we see that 67% of the 🟡 lights were classified as 🔴 , 33% as 🟡 and none as 🟢
👇
We can also get an overview of both FPs and FNs by looking at the Confusion Matrix. It breaks down for each class, how it was classified.
For example, looking at the 🟡 row, we see that 67% of the 🟡 lights were classified as 🔴 , 33% as 🟡 and none as 🟢
👇
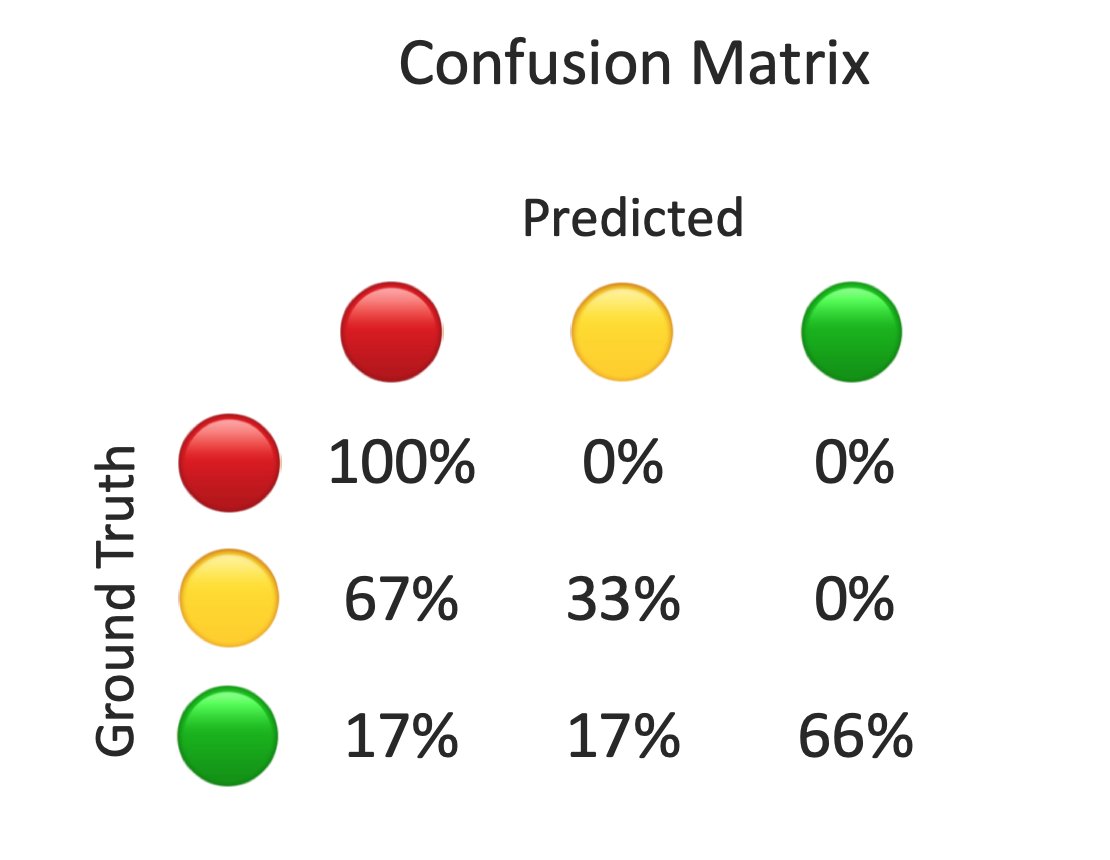
If you look closely, you'll see that the diagonal of the matrix is exactly the Recall.
However, in the Confusion Matrix we can also see where we have FPs - for example, the 🟡 and 🟢 lights that are classified as 🔴.
That's why I like to use the Confusion Matrix.
👇
However, in the Confusion Matrix we can also see where we have FPs - for example, the 🟡 and 🟢 lights that are classified as 🔴.
That's why I like to use the Confusion Matrix.
👇
So, let's summarize:
▪️ Accuracy - doesn't tell us where the problems are
▪️ Recall - ignores FPs
▪️ Precision - ignores FNs
▪️ F1 score - combines Recall and Precision
▪️ Confusion matrix - overview overall error types
You need to choose the best metrics for your application!
▪️ Accuracy - doesn't tell us where the problems are
▪️ Recall - ignores FPs
▪️ Precision - ignores FNs
▪️ F1 score - combines Recall and Precision
▪️ Confusion matrix - overview overall error types
You need to choose the best metrics for your application!
I'm reposting some of my best threads over the year every Friday. On the other days, I regularly write threads like this to help people get started with Machine Learning and web3.
If you are interested in seeing more, follow me @haltakov.
If you are interested in seeing more, follow me @haltakov.
• • •
Missing some Tweet in this thread? You can try to
force a refresh