Chris Billington Profile picture
Dec 17, 2021 7 tweets 6 min read Read on X
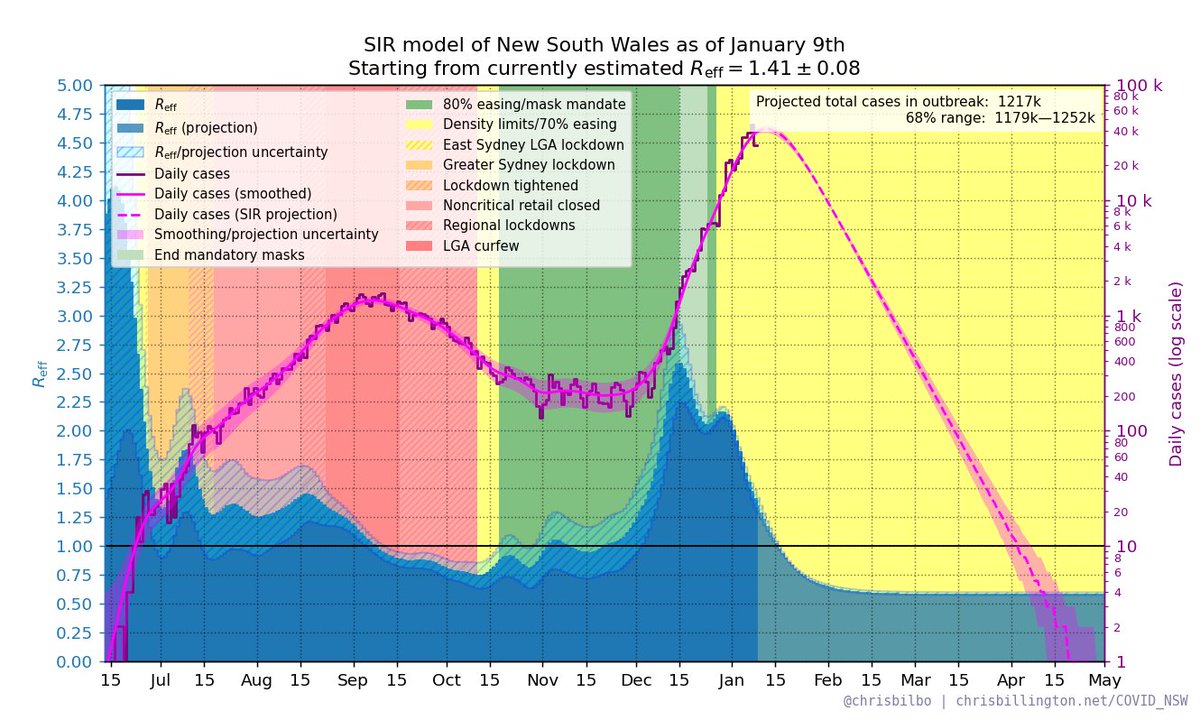
NSW R_eff as of December 18th with daily cases and restrictions. Latest estimate: R_eff = 3.35 ± 0.25

Cases shown on both a linear scale (first image) and log scale (second image).

More info chrisbillington.net/COVID_NSW.html

#covid19nsw #covidsydney
R_eff in Greater Sydney vs rest of New South Wales:

Greater Sydney: R_eff = 2.37 ± 0.27
NSW excluding Greater Sydney: R_eff = 8.55 ± 0.78

(Cases shown on a log scale)

(note region-specific data is several days old, does not include today's cases)

#covid19nsw #covidsydney
R_eff in LGAs of concern* vs the rest of NSW (*all of Penrith included):

LGAs of concern: R_eff = 1.92 ± 0.22
Rest of NSW: R_eff = 5.57 ± 0.50

(Cases shown on a log scale)

(note LGA data is several days old, does not include today's cases)

#covid19nsw #covidsydney
The Hunter region: R_eff = 16.83 ± 0.00

Illawarra region: R_eff = 2.08 ± 0.70

Western New South Wales: R_eff = 5.12 ± 2.51

(Cases shown on a log scale)

(note region-specific data is several days old, does not include today's cases)

#covid19nsw #covidsydney
Expected numbers if the current trend continues:

day cases 68% range
Sun: 3146 2782—3531
Mon: 3892 3426—4387
Tue: 4815 4208—5458
Wed: 5939 5161—6781
Thu: 7306 6313—8403
Fri: 8976 7700—10393
Sat: 10983 9356—12806

Doubling time is 2.9 days.
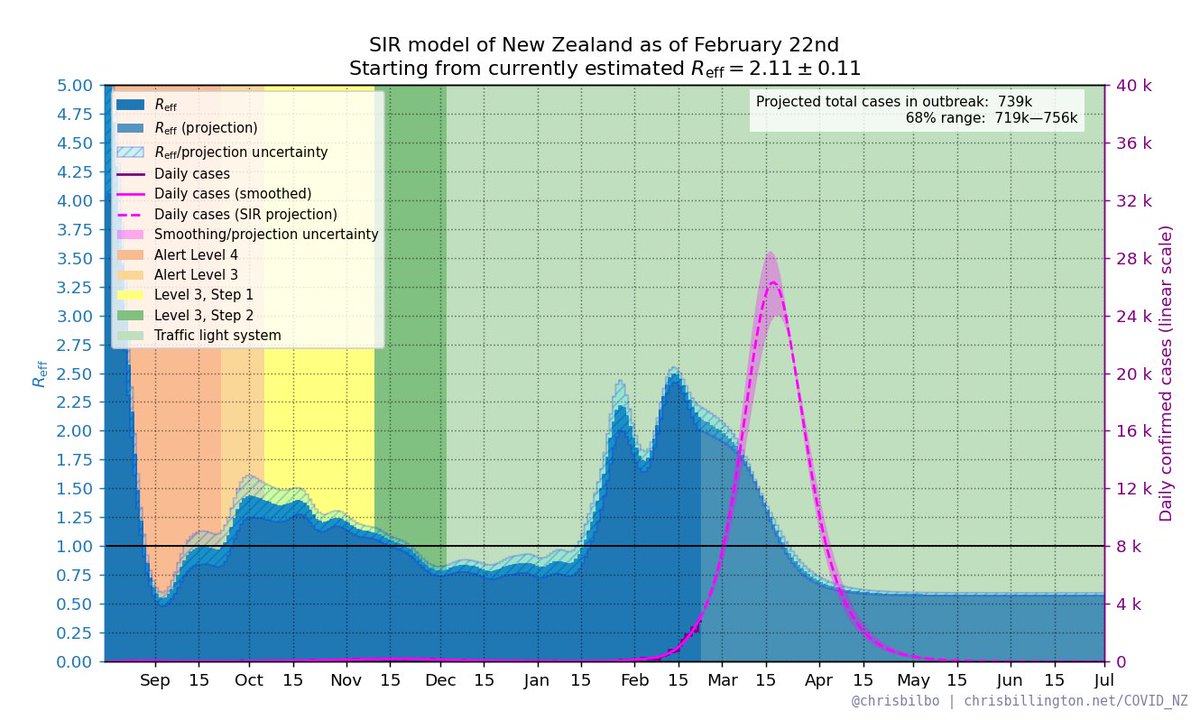
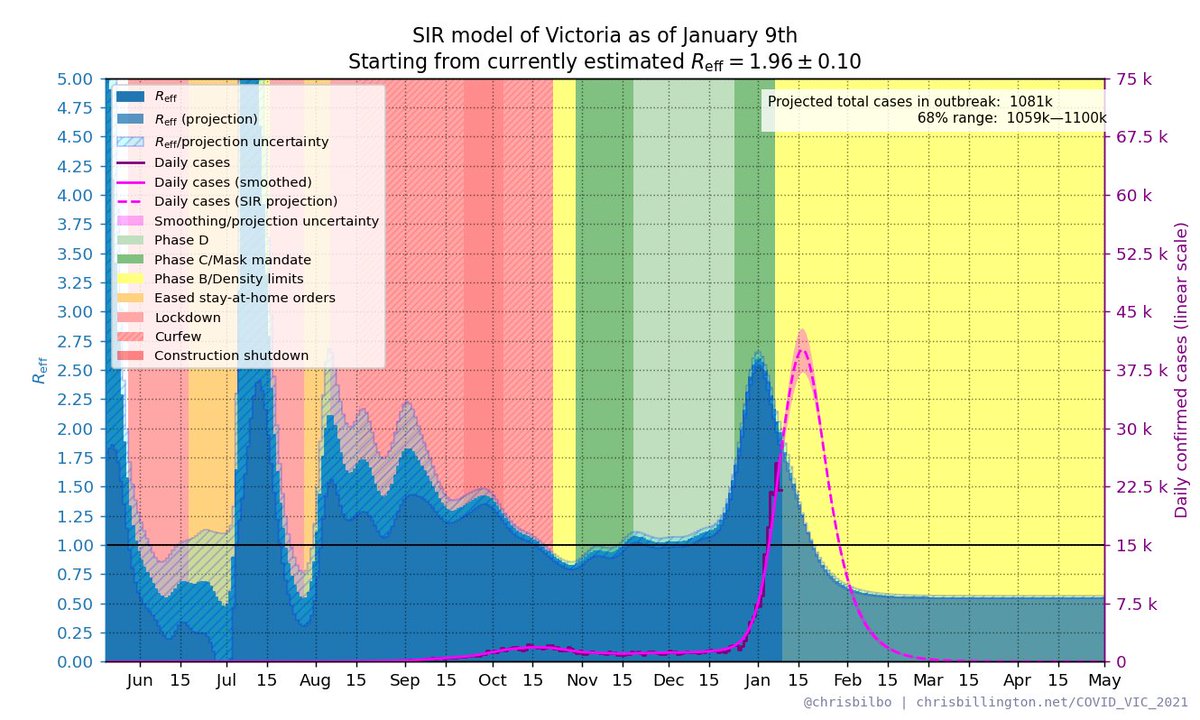
Note that the above trendlines are simple exponential extrapolations. In reality the curve will bend once most have been infected even if nothing else changes. An SIR model that assumes 20% of cases are detected looks like the following (log scale and linear scale shown).
SIR models are pretty simplistic too though, and should be taken with a large grain of salt. The timing of the peak might be a reasonable estimate, but the height could be dramatically different.

• • •

Missing some Tweet in this thread? You can try to force a refresh
 

Keep Current with Chris Billington

Chris Billington Profile picture

Stay in touch and get notified when new unrolls are available from this author!

Read all threads

This Thread may be Removed Anytime!

PDF

Twitter may remove this content at anytime! Save it as PDF for later use!

Try unrolling a thread yourself!

how to unroll video
  1. Follow @ThreadReaderApp to mention us!

  2. From a Twitter thread mention us with a keyword "unroll"
@threadreaderapp unroll

Practice here first or read more on our help page!

More from @Chrisbilbo

Feb 22, 2022
NZ R_eff as of February 22nd with daily cases and restrictions. Latest estimate: R_eff = 2.11 ± 0.11

Plus SIR model projection.

Cases shown on a linear scale (log scale in next tweet).

More info chrisbillington.net/COVID_NZ.html
NZ R_eff as of February 22nd with daily cases and restrictions. Latest estimate: R_eff = 2.11 ± 0.11

Plus SIR model projection.

(Cases shown on a log scale)

More info chrisbillington.net/COVID_NZ.html
Auckland: R_eff = 1.98 ± 0.11

NZ excluding Auckland: R_eff = 2.54 ± 0.17

(Cases shown on a log scale)
Read 4 tweets
Feb 21, 2022
NZ R_eff as of February 21st with daily cases and restrictions. Latest estimate: R_eff = 2.21 ± 0.12

Plus SIR model projection.

Cases shown on a linear scale (log scale in next tweet).

More info chrisbillington.net/COVID_NZ.html
NZ R_eff as of February 21st with daily cases and restrictions. Latest estimate: R_eff = 2.21 ± 0.12

Plus SIR model projection.

(Cases shown on a log scale)

More info chrisbillington.net/COVID_NZ.html
Auckland: R_eff = 2.15 ± 0.13

NZ excluding Auckland: R_eff = 2.42 ± 0.18

(Cases shown on a log scale)
Read 4 tweets
Feb 20, 2022
NZ R_eff as of February 20th with daily cases and restrictions. Latest estimate: R_eff = 2.48 ± 0.13

Plus SIR model projection.

Cases shown on a linear scale (log scale in next tweet).

More info chrisbillington.net/COVID_NZ.html ImageImage
NZ R_eff as of February 20th with daily cases and restrictions. Latest estimate: R_eff = 2.48 ± 0.13

Plus SIR model projection.

(Cases shown on a log scale)

More info chrisbillington.net/COVID_NZ.html ImageImage
Auckland: R_eff = 2.36 ± 0.15

NZ excluding Auckland: R_eff = 2.84 ± 0.21

(Cases shown on a log scale) ImageImage
Read 4 tweets
Jan 9, 2022
VIC R_eff as of January 9th with daily cases and restrictions. Latest estimate: R_eff = 1.96 ± 0.10

Plus SIR model projection.

Cases shown on a linear scale (log scale in next tweet).

More info chrisbillington.net/COVID_VIC_2021…

#COVID19Vic
VIC R_eff as of January 9th with daily cases and restrictions. Latest estimate: R_eff = 1.96 ± 0.10

Plus SIR model projection.

(Cases shown on a log scale)

More info chrisbillington.net/COVID_VIC_2021…

#COVID19Vic
Cases in VIC if the current trend continues:

day cases 68% range
Mon: 28281 25903—30742
Tue: 30939 28189—33797
Wed: 33482 30331—36691
Thu: 35707 32263—39301
Fri: 37606 33864—41473
Sat: 39006 35068—43041
Sun: 39862 35846—43962

Doubling time is 5.2 days.

#COVID19Vic
Read 4 tweets
Jan 8, 2022
NSW R_eff as of January 9th with daily cases and restrictions. Latest estimate: R_eff = 1.41 ± 0.08

Plus SIR model projection.

Cases shown on a linear scale (log scale in next tweet).

More info chrisbillington.net/COVID_NSW.html

#covid19nsw #covidsydney
NSW R_eff as of January 9th with daily cases and restrictions. Latest estimate: R_eff = 1.41 ± 0.08

Plus SIR model projection.

(Cases shown on a log scale)

More info chrisbillington.net/COVID_NSW.html

#covid19nsw #covidsydney
R_eff in Greater Sydney vs rest of New South Wales:

Greater Sydney: R_eff = 1.85 ± 0.09
NSW excluding Greater Sydney: R_eff = 2.32 ± 0.16

(Cases shown on a log scale)

(note region-specific data is several days old, does not include today's cases)

#covid19nsw #covidsydney
Read 6 tweets
Jan 8, 2022
TAS R_eff as of January 8th with daily cases. Latest estimate: R_eff = 2.74 ± 0.42

Plus SIR model projection.

Cases shown on a linear scale (log scale in next tweet).

More info chrisbillington.net/COVID_TAS.html
TAS R_eff as of January 8th with daily cases. Latest estimate: R_eff = 2.74 ± 0.42

Plus SIR model projection.

(Cases shown on a log scale)

More info chrisbillington.net/COVID_TAS.html
Cases in TAS if the current trend continues:

day cases 68% range
Sun: 1521 1136—1942
Mon: 1787 1319—2300
Tue: 2082 1523—2702
Wed: 2404 1737—3146
Thu: 2746 1967—3616
Fri: 3096 2196—4081
Sat: 3432 2426—4534

Doubling time is 3.4 days.
Read 4 tweets

Did Thread Reader help you today?

Support us! We are indie developers!


This site is made by just two indie developers on a laptop doing marketing, support and development! Read more about the story.

Become a Premium Member ($3/month or $30/year) and get exclusive features!

Become Premium

Don't want to be a Premium member but still want to support us?

Make a small donation by buying us coffee ($5) or help with server cost ($10)

Donate via Paypal

Or Donate anonymously using crypto!

Ethereum

0xfe58350B80634f60Fa6Dc149a72b4DFbc17D341E copy

Bitcoin

3ATGMxNzCUFzxpMCHL5sWSt4DVtS8UqXpi copy

Thank you for your support!

Follow Us!

:(