
Working on embedded and automation software for portable atomic clocks at Adelaide University, former atomic physicist, generally a nerd

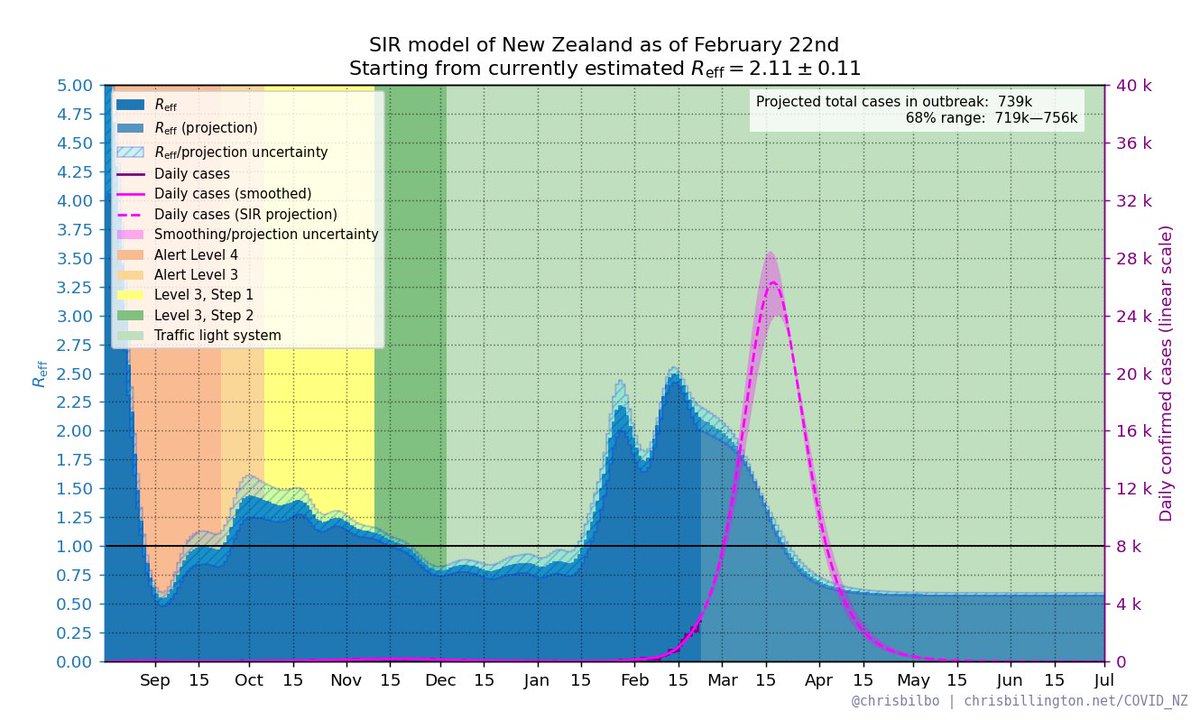 NZ R_eff as of February 22nd with daily cases and restrictions. Latest estimate: R_eff = 2.11 ± 0.11


 NZ R_eff as of February 21st with daily cases and restrictions. Latest estimate: R_eff = 2.21 ± 0.12

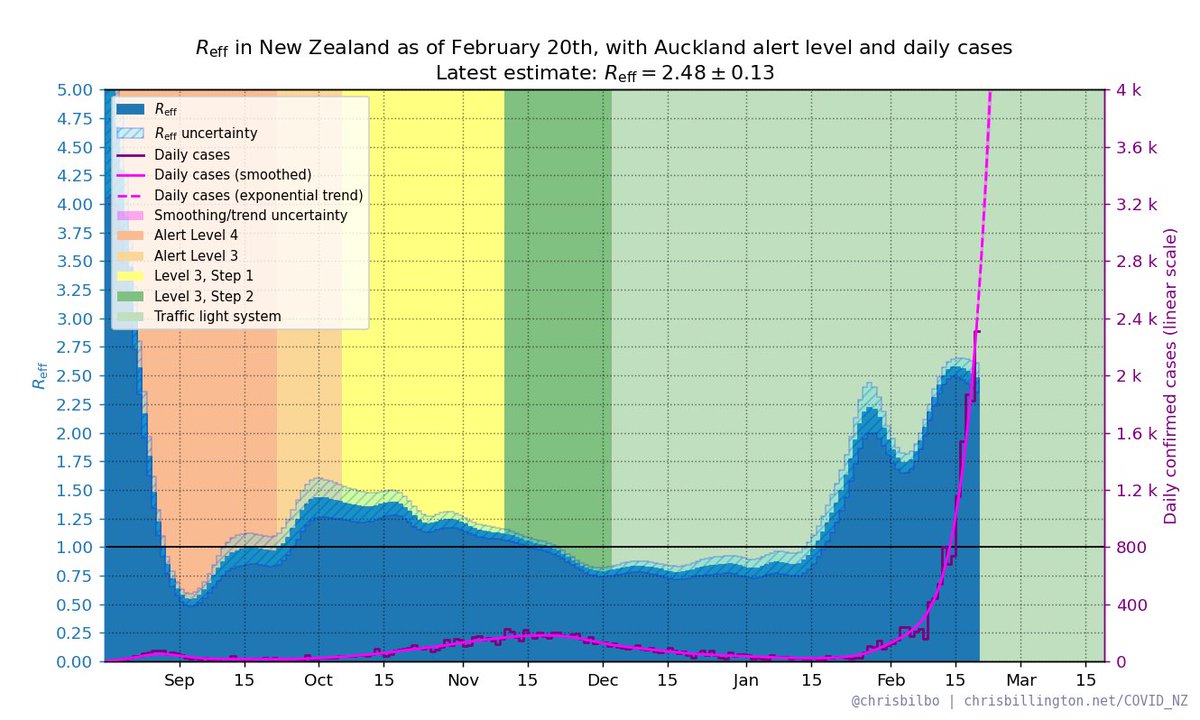
 NZ R_eff as of February 20th with daily cases and restrictions. Latest estimate: R_eff = 2.48 ± 0.13


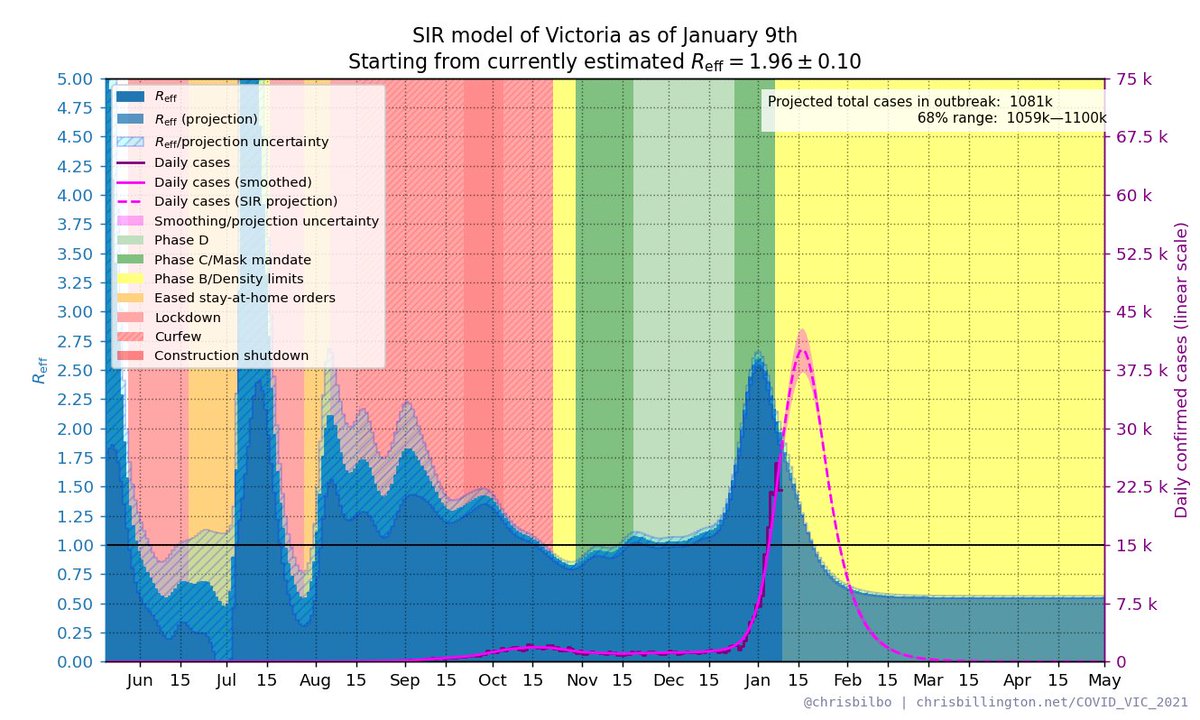 VIC R_eff as of January 9th with daily cases and restrictions. Latest estimate: R_eff = 1.96 ± 0.10


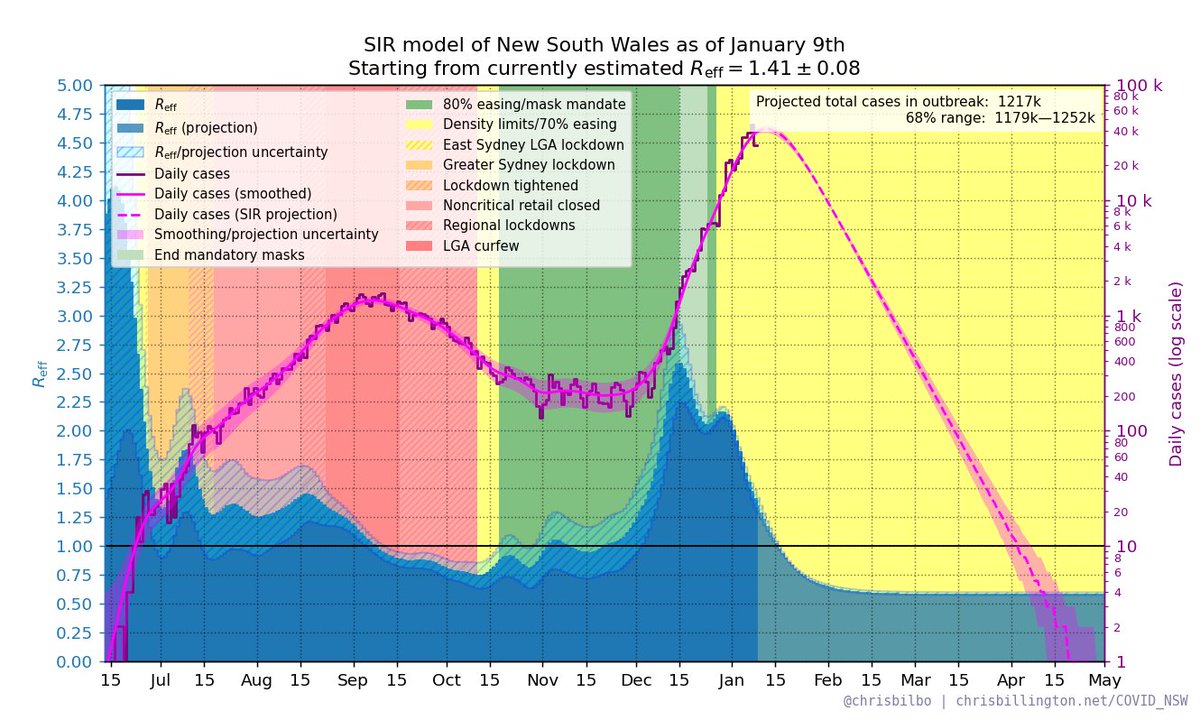
 NSW R_eff as of January 9th with daily cases and restrictions. Latest estimate: R_eff = 1.41 ± 0.08

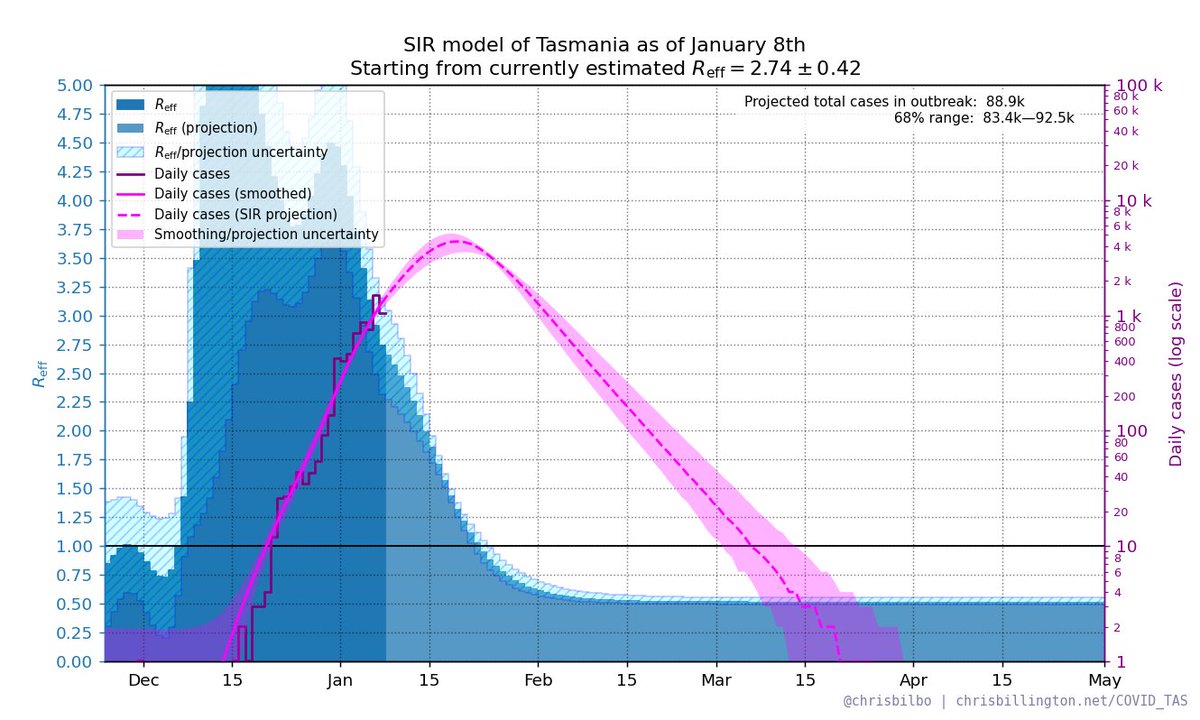
 TAS R_eff as of January 8th with daily cases. Latest estimate: R_eff = 2.74 ± 0.42


 VIC R_eff as of January 8th with daily cases and restrictions. Latest estimate: R_eff = 2.34 ± 0.09


 NSW R_eff as of January 8th with daily cases and restrictions. Latest estimate: R_eff = 1.69 ± 0.07


 NSW R_eff as of January 7th with daily cases and restrictions. Latest estimate: R_eff = 1.76 ± 0.08


 R_eff in Greater Sydney vs rest of New South Wales:


 R_eff in Greater Sydney vs rest of New South Wales:


 R_eff in Greater Sydney vs rest of New South Wales:


 VIC R_eff as of October 2nd with daily cases and restrictions. Latest estimate: R_eff = 1.53 ± 0.09


 ACT R_eff as of October 1st with daily cases and restrictions. Latest estimate: R_eff = 1.71 ± 0.53


 NSW R_eff as of October 1st with daily cases and restrictions. Latest estimate: R_eff = 0.91 ± 0.04


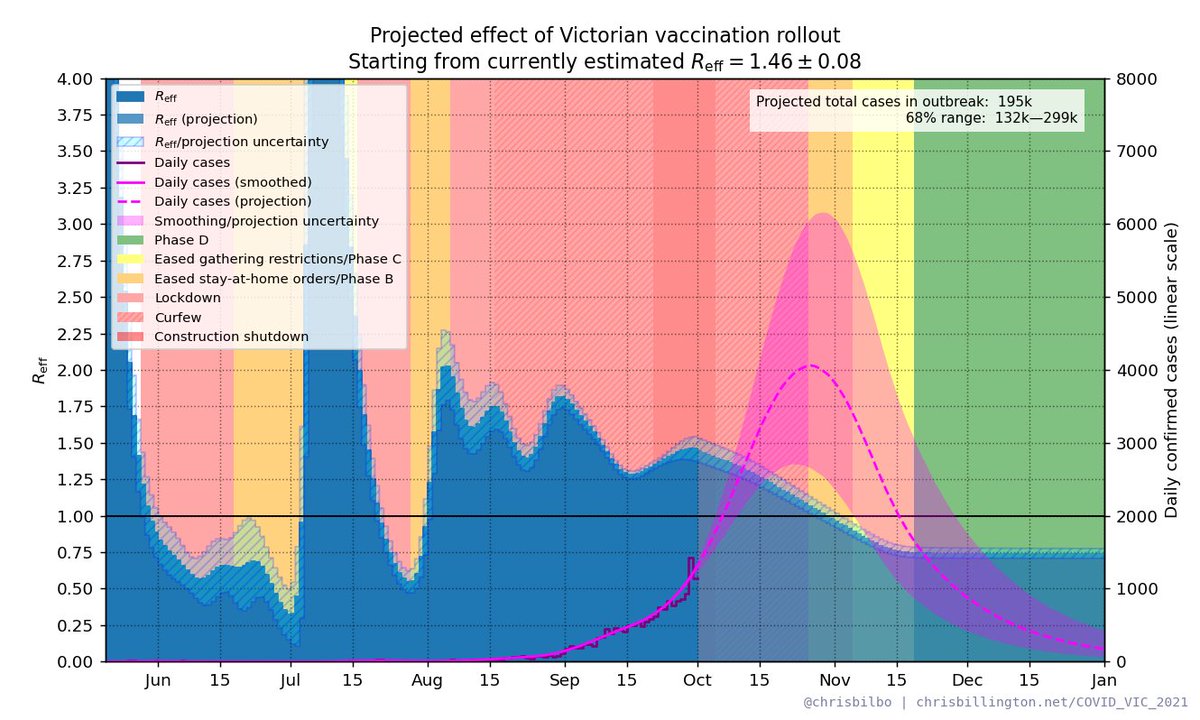 VIC R_eff as of October 1st with daily cases and restrictions. Latest estimate: R_eff = 1.46 ± 0.08
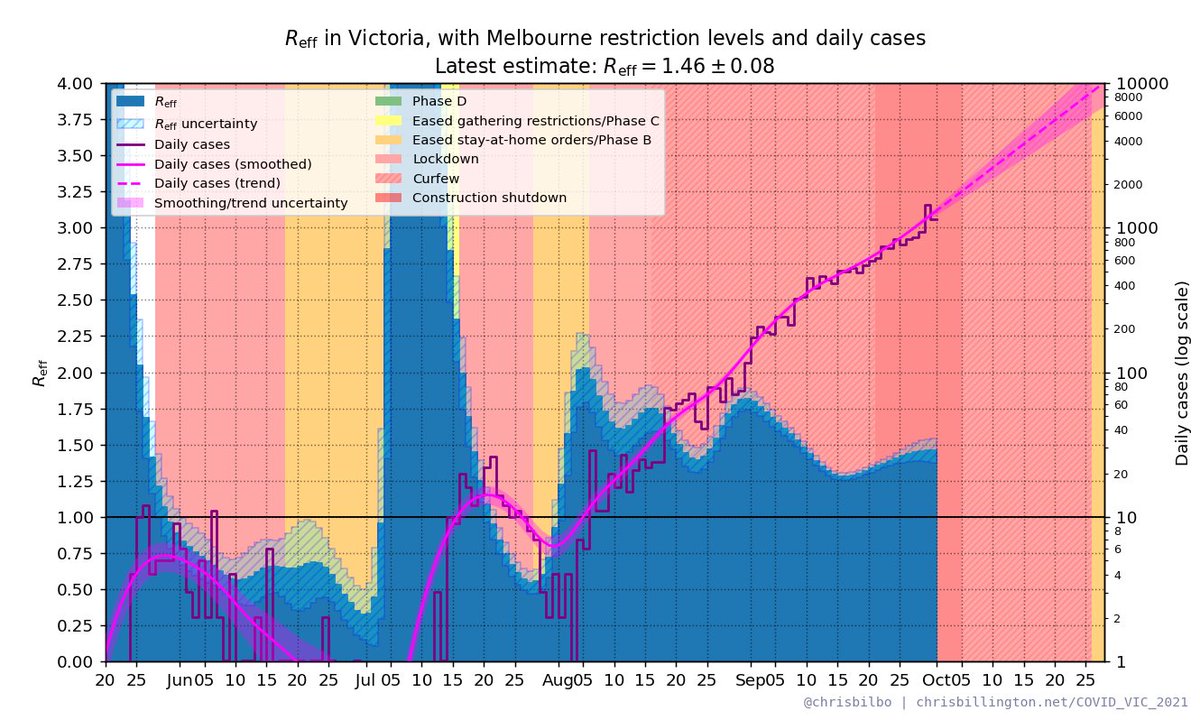


 NSW R_eff as of September 30th with daily cases and restrictions. Latest estimate: R_eff = 0.89 ± 0.04
