Ilkka Rauvola Profile picture
Dec 18, 2021 10 tweets 4 min read Read on X
Denmark/Omicron 18 Dec 2021: first look at people in hospital data. Looks to me that people who are in hospital have tested positive 6-7 days earlier.
1/x
Also it would appear that the amount of people in hospital is about 1.9-2.2 percent of people who tested positive 6-7 days earlier. That level is 79-83 percent lower than the overall level of people in hospital in Denmark before the Omicron wave (10.3-10.8%).
2/x
How each point in this graph has been calculated:
- reliable data on new cases exists only up to 13 Dec
- first example (red circle): comparing people in hospital 15-17 Dec with new cases 11-13 Dec (=4 days earlier)
3/x
1) people in hospital: sum of last 3 days = 52
2) new Omicron cases 4 days earlier = 5505
3) 52/5505 = 0.94 percent (data point for 17 Dec)
4/x
Example 2: calculating all the data points on the 7 day line.
5/x
Here are all the data points calculated on the 7 day line. Example: data point for 17 Dec = 52/2357 = 2.21 percent.
6/x
Here is a cumulative version of the above graph. There appears to be initial convergence towards the 6-7 day range (which would mean that people are at hospital an average of 6-7 days after having tested positive with Omicron).
7/x
Here is a quick calculation of length of hospital stay
- hospital stay appears roughly 0.85 days
- therefore: admissions to be measured at the 5-6 day point
8/x
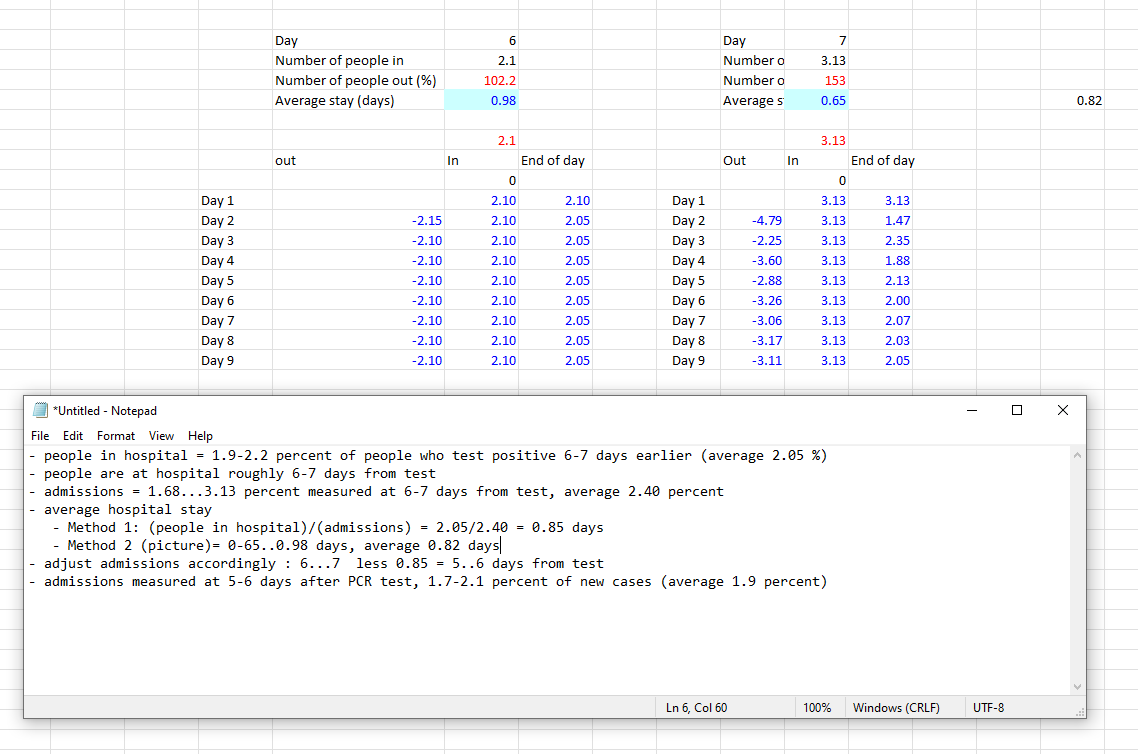
Therefore Omicron admissions in Denmark, measured at the 5-6 day mark, are estimated at 1.7-2.1 percent of people who tested positive 5-6 days earlier.
9/x
Summary estimates:
- roughly 1.7-2.1 percent of people, who have tested positive 5-6 days earlier, are admitted to hospital, where they stay an average of 0.85 days
- roughly 1.9 - 2.2 percent of people who tested positive 6-7 days earlier are at hospital
10/x

• • •

Missing some Tweet in this thread? You can try to force a refresh
 

Keep Current with Ilkka Rauvola

Ilkka Rauvola Profile picture

Stay in touch and get notified when new unrolls are available from this author!

Read all threads

This Thread may be Removed Anytime!

PDF

Twitter may remove this content at anytime! Save it as PDF for later use!

Try unrolling a thread yourself!

how to unroll video
  1. Follow @ThreadReaderApp to mention us!

  2. From a Twitter thread mention us with a keyword "unroll"
@threadreaderapp unroll

Practice here first or read more on our help page!

More from @jukka235

Nov 30
Congenital malformations, deformations and chromosomal abnormalities. For 1-6 year olds,
- the condition showing largest increase since 2022 is Down's syndrome (Q90)
- the condition showing fastest growth since 2022 is Congenital malformations of great arteries (Q25)
1/x Image
Image
1-6 year olds / chromosomal abnormalities (Q90-Q99).
- Down's syndrome (Q90): average patient growth (2022-2025e) 14% per year = 10x in 18 years)
- fastest growing condition: other sex chromosome abnormalities, male phenotype (Q98), up 150% in 2025e
2/x Image
Image
Image
<1 year olds / chromosomal abnormalities (Q90-Q99):
- Down's syndrome (Q90) is the most frequent diagnosis
3/x Image
Image
Read 9 tweets
Nov 11
Intellectual disabilities (F70-F79): <1 year olds are leading in terms of y/y growth. Ten percent of <1 year olds will have an intellectual disability diagnosis in 14 year's time (2039), if current growth rates continue.
1/x Image
The rise in intellectual disability among <1 year olds also shows in number of diagnoses: up roughly 11 times in 4 years. Also note the rise among 1-6 year olds.
2/x Image
7-14 and 15-24 year olds are showing the highest levels of intellectual disability. If current growth rates continue, 5 percent of 7-14 and 15-24 year olds will have an intellectual disability diagnosis by 2048 (24 years from now).
3/x Image
Read 6 tweets
Nov 3
Last time I checked, unvaccinated 30-49 year olds were dying at a rate 39 times higher than those who had received two vaccine doses. Finland.

(link below) Image
Read 6 tweets
Oct 27
In 30 years from now, 5 percent of 1–6 year olds and 8 percent of 25–49 year olds will be walking with white sticks, if current growth trends continue. Image
Here is the graph for all age groups, all of which are showing quite uniform y/y growth. Patients / public outpatient healthcare.
2/x Image
For total population, visual disturbances and blindness have doubled since the onset of the pandemic. There has been no letup in recent years. Average growth rate is power(1.97, 1/5) = 14.5 percent per year (= 10x every ln(10)/ln(1.145)= 17 years).
3/x Image
Read 9 tweets
Sep 18
Malignant neoplasms (C00-C97): number of diagnoses is up year-on-year in all age groups below 50.
1/x Image
Image
Image
Image
Meant to say either diagnoses or patients. For 25-49 year olds, diagnoses are down 12% y/y in 2025e, but patients are up 12% y/y in 2025e.
2/x Image
Image
For 15-24 year olds, number of patients is up 1.2% y/y in 2025e while number of diagnoses is down.
3/x Image
Image
Read 33 tweets
Sep 14
Finland's epidemic 14 Sep 2025: year-to-date number of patients in 2025 is already higher than at any time during the pandemic. There are 5 more months to go. 1/x Image
Suomen epidemia 14.9.2025: kaikkien sairauksien potilasmäärä vuoden 2025 alusta ylittää jo nyt pandemian edellisten vuosien potilasmäärät, ja vuotta on vielä 5 kuukautta jäljellä.
2/x Image
Almost 80 percent of pregnancies and childbirths now involve complications and diseases.
3/x Image
Read 7 tweets

Did Thread Reader help you today?

Support us! We are indie developers!


This site is made by just two indie developers on a laptop doing marketing, support and development! Read more about the story.

Become a Premium Member ($3/month or $30/year) and get exclusive features!

Become Premium

Don't want to be a Premium member but still want to support us?

Make a small donation by buying us coffee ($5) or help with server cost ($10)

Donate via Paypal

Or Donate anonymously using crypto!

Ethereum

0xfe58350B80634f60Fa6Dc149a72b4DFbc17D341E copy

Bitcoin

3ATGMxNzCUFzxpMCHL5sWSt4DVtS8UqXpi copy

Thank you for your support!

Follow Us!

:(