
1/ I mirror his words back now @dimgrr
The OWID website is one of the worst. After almost a 2 years, there still aren't any age de-confounded ASMR, and the coverage time series only include misleading aggregated figures. OWID delivers one Simpson's paradox after another.
The OWID website is one of the worst. After almost a 2 years, there still aren't any age de-confounded ASMR, and the coverage time series only include misleading aggregated figures. OWID delivers one Simpson's paradox after another.
https://twitter.com/redouad/status/1472851097328959492
2/ Here some input for @redouad. OWID likes to fear porn with unadjusted death figures. Even better with cumulated "total deaths" (sounds scary right?) over several years.
Better method:
orwell2024.substack.com/p/age-adjusted…
Better method:
orwell2024.substack.com/p/age-adjusted…
3/ Doing it correctly at OWID, you would be able to understand what is happening Mr. Edouard.
Instead, you troll Netherlands and @rivm while having such a bad service yourself.
Change the name OWID to OACUD:
"Our Age Confounded Useless Data".
Here de-confounded👇
Instead, you troll Netherlands and @rivm while having such a bad service yourself.
Change the name OWID to OACUD:
"Our Age Confounded Useless Data".
Here de-confounded👇

4/ Let's play a game Edouart. Find the pandemic in ASMR data:
Can you solve the puzzle?
Can you solve the puzzle?
https://twitter.com/orwell2022/status/1473243029788110848?s=20
5/ You want to understand the Netherlands?
In detail here: orwell2024.substack.com/p/netherlands-…
https://twitter.com/orwell2022/status/1470709554543480837?s=20
In detail here: orwell2024.substack.com/p/netherlands-…

6/ The results are interesting, and give a very different story once de-confounded by demographics, which your service doesn't do.
You must love to work with the Simpson's paradox.
You must love to work with the Simpson's paradox.
https://twitter.com/orwell2022/status/1470725031244312581?s=20
8/ For the "Our Age Confounded Useless Data" at OWID "experts".
I here explain what is really going on without using age confounded "sum of all deaths".
I here explain what is really going on without using age confounded "sum of all deaths".


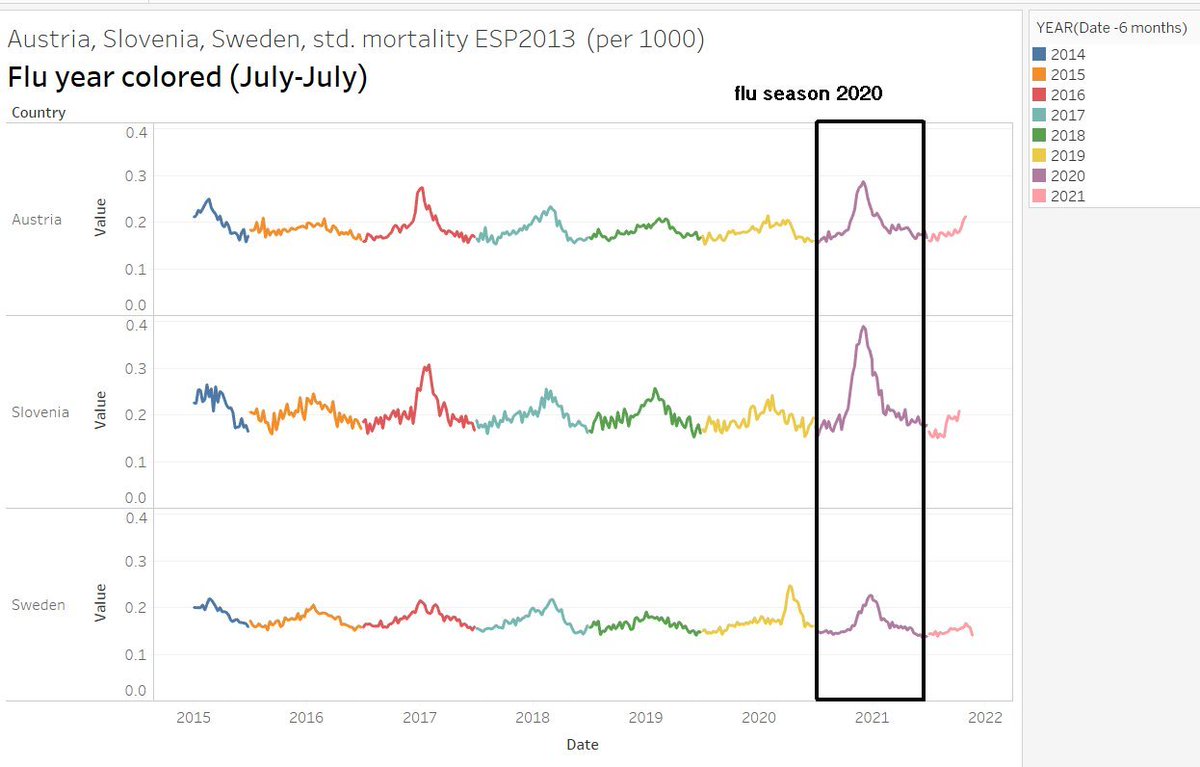
9/ Doing this by flu season (July-June) instead of calendar year (which you are doing) we get an even clearer picture.
The eternal lockdowns aren't that healthy at the end, or are they?
The eternal lockdowns aren't that healthy at the end, or are they?
https://twitter.com/orwell2022/status/1471778424528244737?s=20

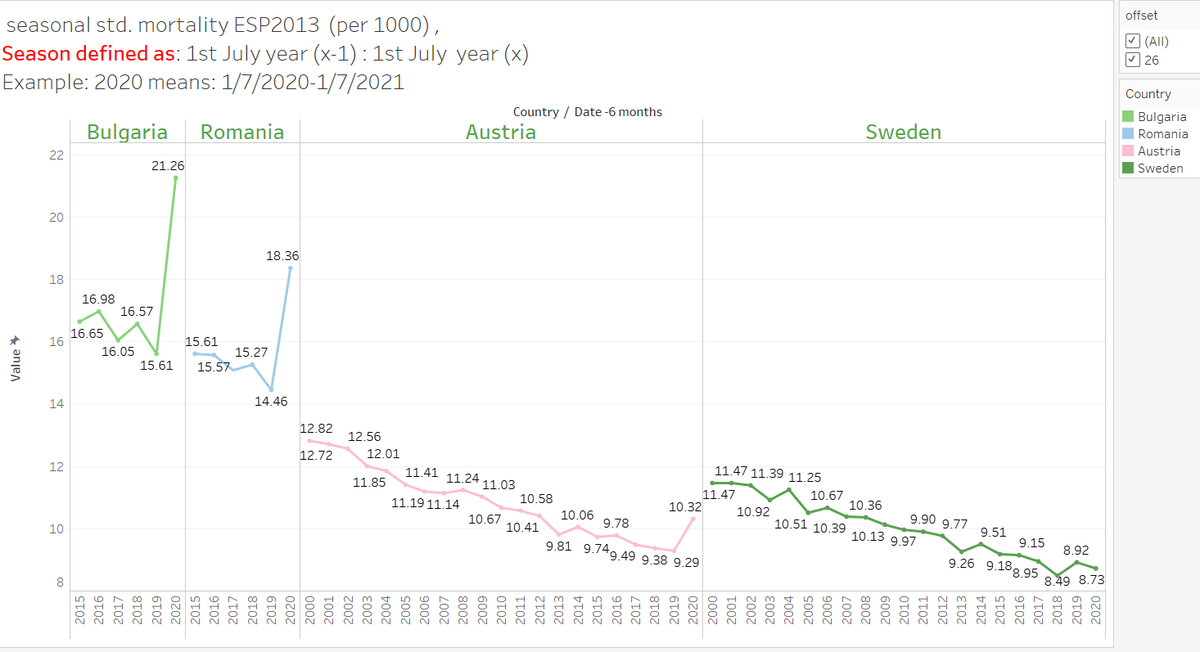
10/ And it gets worse in poor countries:
Can you see how lockdowns saved lives. "Our Age Confounded Useless Data" OWID is co-responsible for fuelling this lockdown mass hysteria. Is it the flavour of your money source? Gates and WHO?
Can you see how lockdowns saved lives. "Our Age Confounded Useless Data" OWID is co-responsible for fuelling this lockdown mass hysteria. Is it the flavour of your money source? Gates and WHO?
https://twitter.com/orwell2022/status/1471757624664367108?s=20
11/ How do you explain that the unvaccinated in east Germany were already dying in 2017? A time machine?
https://twitter.com/orwell2022/status/1470857044391612420?s=20


13/ We can do this on country level as well:
Can you see it Edouart?
Can you see it Edouart?
https://twitter.com/orwell2022/status/1472210608607186945?s=20

14/ Here is Germany with 2021 included:
Vaccine or obesity? What do you think fits better.
Vaccine or obesity? What do you think fits better.

15/ Now ASMR for more countries with 2021 included. The grey countries have no data yet in ec.europa.eu/eurostat/datab… up to week 47, therefore not shown.
Orwell2022 age de-confounded data
...or...
@redouad "Our Age Confounded Useless Data" (OWID).
What is better?
Orwell2022 age de-confounded data
...or...
@redouad "Our Age Confounded Useless Data" (OWID).
What is better?

16/ Why is OWID doing this? They seem to have more urgent issues like the use of political correct(?) "colour blind" colour codes.
I recommend the comments section where @redouad engaged (showing his irritation):
I recommend the comments section where @redouad engaged (showing his irritation):
https://twitter.com/orwell2022/status/1468508454591647748?s=20


17/ So let's vote for @redouad
Which map is better in helping the human colour vision brain process information faster?
A) The colour blind version of OWID?
B) The high colour contrast version of Wikipedia?
A hint: can you spot Papua-Neuguinea's problem in OWID's new colours?
Which map is better in helping the human colour vision brain process information faster?
A) The colour blind version of OWID?
B) The high colour contrast version of Wikipedia?
A hint: can you spot Papua-Neuguinea's problem in OWID's new colours?
• • •
Missing some Tweet in this thread? You can try to
force a refresh


