Tom Moultrie Profile picture
Dec 22, 2021 21 tweets 8 min read Read on X
Latest @MRCza and @UCT_news report on excess deaths in South Africa released, covering the period to 18Dec21. 280 000 excess natural deaths (471/100 000) since 3May2020.
Report available here: samrc.ac.za/reports/report…
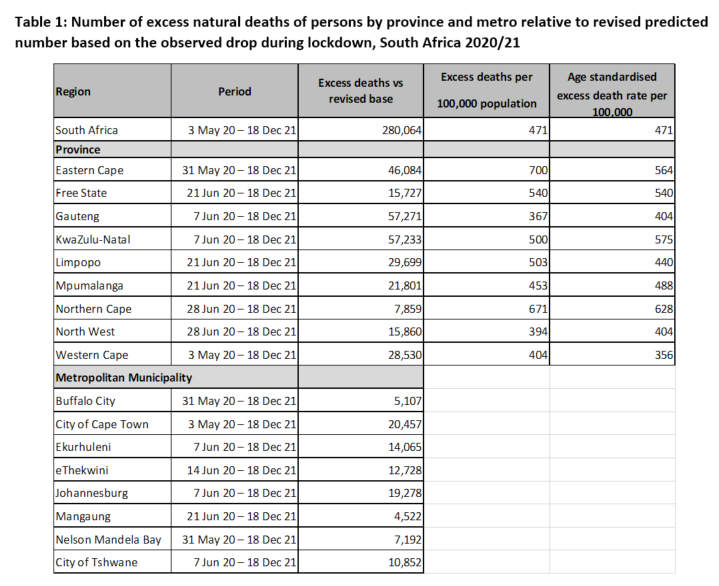
2/ Nationally, natural deaths were 33% above expected (the p-score), compared to 18% the previous week. 2 600 excess natural deaths in the most recent week (12-18Dec), up from 1500 the previous week.
70% of excess deaths were among those aged 60+.
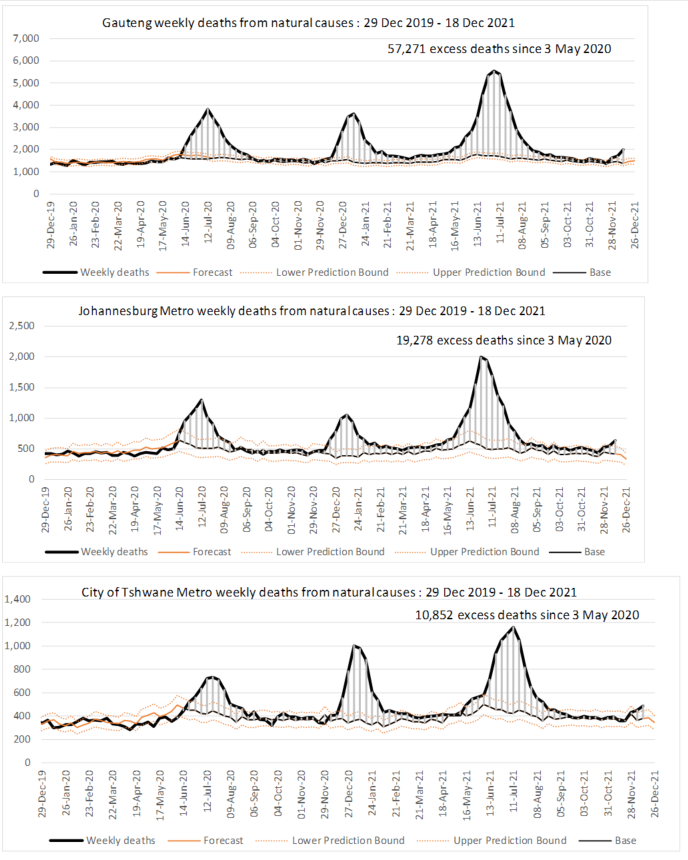
3/ By province, excess deaths increased in Gauteng over the week (p-score up from 16 to 44%). Limpopo up from 19% to 47%. Deaths in Johannesburg was 53% above expected (last week 27%). But still FAR below the peaks in previous waves
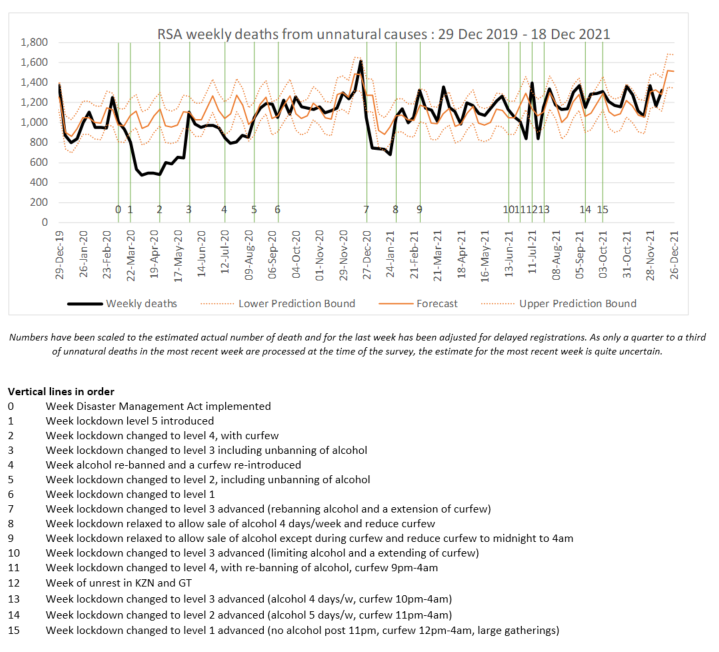
4/ Unnatural deaths follow the expected weekly pattern very closely.
5/ I recorded earlier this week that the official death numbers are both laggy and complete. The figure below shows the reported deaths (by reporting date) and excess natural deaths (by occurrence).
6/ The differential quality of reporting in a devolved healthcare system is evident. While the Western Cape reporting captures most of the quantity of the excess deaths and is consistent with the temporal pattern, other provinces do not do as well (e.g. Mpumalanga).
7/ With such differences in reporting within a single country (where we have an idea of a counterfactual), the potential scale of under-reporting in many other sub-Saharan African countries becomes apparent.
/8 The @nicd_sa testing report has yet to be released ... will append comments to this thread when it is. But in the meantime
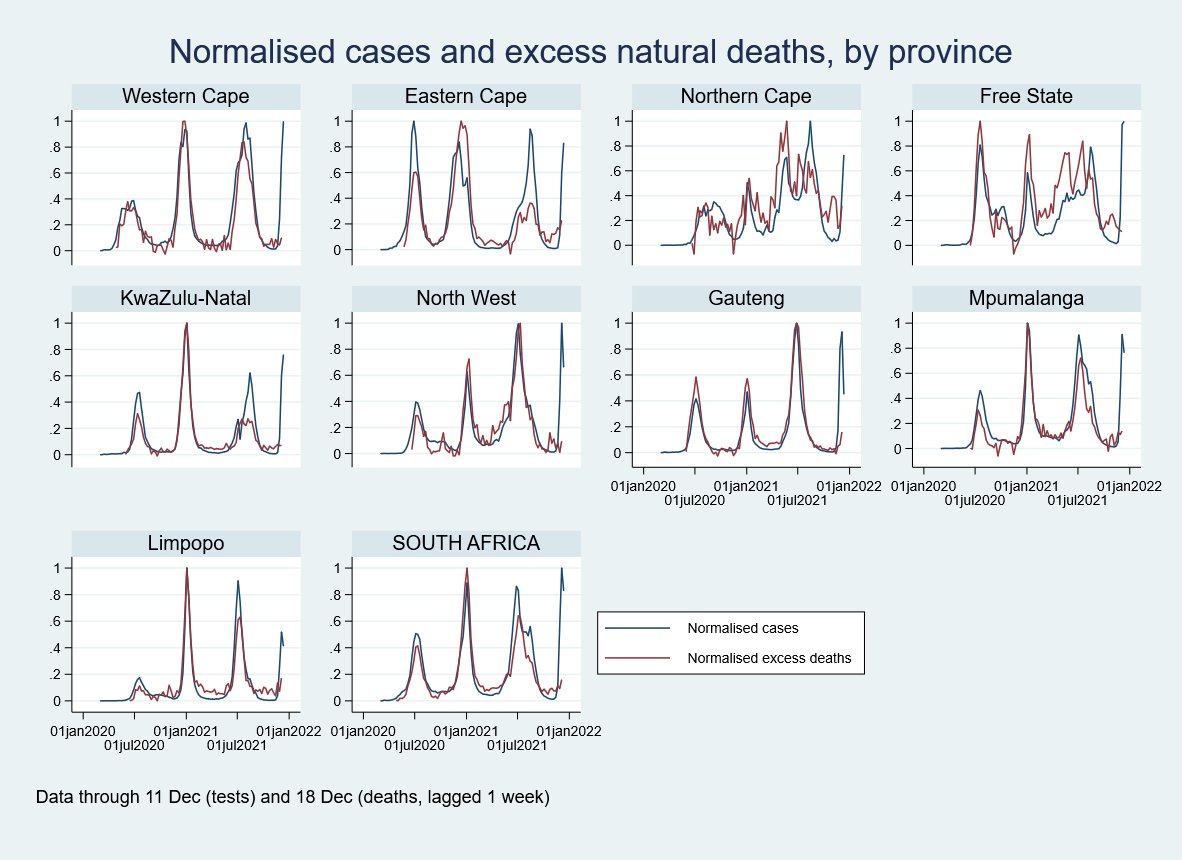
9/ Combining the data from testing and excess deaths. The pattern previously described persists, with a substantial decoupling of deaths from cases: the figure below shows the cases and (lagged) excess deaths normalised to their historical peaks
10/ The same data, looked at differently: lagged p-score plotted against PTP, by wave. (Definitions of when a wave ends and the next begins are somewhat arbitary; here based on when National PTP turns upwards –for W4, on 7Nov21).
11/ This also shows much lower excess natural mortality for a given PTP across the board (red dots).
12/ So again – overwhelmingly positive news. It really does look like this wave will not be as bad as previous ones. Here’s hoping this is true in other parts of the world too. In the meantime, stay safe, be safe, vaccinate.
13/ lastly (for now, until comments on the testing data are added): the next report on excess deaths is scheduled for 5 Jan 2022.
14/ At last! The @NICD_sa has released its weekly testing report, covering testing through 18Dec21. Proportion testing positive (PTP), nationally, increased from 35.7% to 36.7%, but fell sharply in Gauteng (from 28.6% to 29.1%).nicd.ac.za/diseases-a-z-i…
15/ Provincial PTP exceeded 40% in 7 provinces. By age, PTP highest among those aged 10-19, but PTP exceeded 30% in every age group other than those under 5. PTP increased in each age group other than those aged 10-39, where small declines were observed.
16/ 195 of 262 districtis in the country showed a PTP greater than 30% in the week to 18Dec21
17/ For Gauteng (daily data; PCR only) - cases are falling faster than PTP as testing volumes fall. (Thus: looking at trends in cases exaggerates the pace of decline, although evidently a decline has been under way for some time now on either metric)
18/ Nationally (PCR tests only), the 7day centred moving average is falling consistently. The national pattern APPEARS to have stalled at a high peak, but that is a compositional effect of PTP falling in the northern provinces, rising in the coastal provinces ...
19 (end)/ ... and changing volumes by province over time.

That said, it feels very odd to be celebrating the decline in PTP in Gauteng. In recent days, it's STILL around 20-25%. It has a LONG way to fall before this wave is over.
@nicd_sa Aaargh! *38.6%**.
Addition to thread reflecting release of NICD testing report...

• • •

Missing some Tweet in this thread? You can try to force a refresh
 

Keep Current with Tom Moultrie

Tom Moultrie Profile picture

Stay in touch and get notified when new unrolls are available from this author!

Read all threads

This Thread may be Removed Anytime!

PDF

Twitter may remove this content at anytime! Save it as PDF for later use!

Try unrolling a thread yourself!

how to unroll video
  1. Follow @ThreadReaderApp to mention us!

  2. From a Twitter thread mention us with a keyword "unroll"
@threadreaderapp unroll

Practice here first or read more on our help page!

More from @tomtom_m

Dec 14, 2022
Weekly excess deaths in South Africa. A final thread. The report released by the @MRCza and @UCT_news collaboration on excess deaths in South Africa in the week to 10Dec22 was released today. The report is here:samrc.ac.za/reports/report… /1
The report is the last of 138 reports issued weekly since 30Mar20. The first report covered the period to 15Mar20, the second (on 6Apr20) the period to 31Mar20. 39 weekly reports were issued in 2020; 50 in 2021; and 49 in 2022. /2
In addition to providing data in machine readable format since 23Jun20, the collaboration has produced many technical notes, methodological reports, and explainers. /3
Read 23 tweets
Dec 9, 2022
Apologies for the delay in the weekly deaths and testing summaries - reports from @MRCza and @nicd_sa now released! (Delay due to late release of testing data).
In the week to 3Dec22, 450 excess natural deaths were recorded, bringing the total since 3May20 to 338 300.
The report is available here: The excess deaths report is here: samrc.ac.za/reports/report…. In the week to 3Dec22, natural deaths were 5.6% above expected, ranging from -7.6% in NC to 15.1% in EC.
As can be seen, little signal (and quite a lot of noise) in the data for some time now. Unnatural deaths continue to follow the expected patterns and levels
Read 6 tweets
Jul 27, 2022
Latest weekly @MRCza and @UCT_news report on excess deaths in South Africa released. 801 excess natural deaths in the week to 23Jul22; 326 000 since 3May20. Report here: samrc.ac.za/reports/report…
Observed natural deaths for the week were 8.7% above that expected, very slightly higher than the upper prediction bound. Provincially, p-scores range from 1.8% in NW to 24.5% in NC. (only NC and EC - 20.3% -) exceed 10% above expected.
Excess deaths are low in (almost) every age group, are negligible in and are at much lower levels than in previous waves of infection. p-scores in every age group are less than 25%,and are negative between ages 20 and 59.
Read 6 tweets
Jul 20, 2022
Latest @MRCza and @UCT_News report on excess deaths in South Africa released. Issues in the data received from Home Affairs have led to a caution being issued with this week's data. Report here: samrc.ac.za/reports/report…
325k excess deaths between 3May20 and 16Jul22. While the increment in the week to 16Jul22 is low, the caution above should be borne in mind and results should not be over-interpreted; the correction will come through in due course.
Natural deaths in the week were 4.8% higher than expected (see caveat), ranging from -13.5% (NW) to +23.8% (NC).
Read 7 tweets
Jul 13, 2022
Latest @MRCza and @UCT_news report on excess deaths in South Africa is out; covering the week to 9Jul22. 325k excess natural deaths since 3May20; 1100 in the most recent week. Report here: samrc.ac.za/reports/report…
Excess natural deaths of those under age 60 back to the predicted levels; those over 60 still somewhat above. Nationally, natural deaths were 12.0% above expected with most provinces close to or within the prediction range.
The p-score by age band shows that excess mortality concentrated in those aged 60+. (The odd pattern of those under 5 may reflect an earlier RSV season than anticipated, with excess mortality in past months, now reverting to baseline).
Read 7 tweets
Jun 29, 2022
Latest @MRCza and @UCT_news report on excess deaths in South Africa, covering the week to 25Jun22, released. 322419 excess natural deaths since 3May20, 1112 in the week to 25June22, the lowest since 3-9April22. Report --> samrc.ac.za/reports/report…
Natural deaths in the week to 25Jun22 were 11.6% above expected, ranging from 20.1% in KZN to -3.4% in the Western Cape.
Unnatural deaths continue to stick closely to the expected numbers.
Read 7 tweets

Did Thread Reader help you today?

Support us! We are indie developers!


This site is made by just two indie developers on a laptop doing marketing, support and development! Read more about the story.

Become a Premium Member ($3/month or $30/year) and get exclusive features!

Become Premium

Don't want to be a Premium member but still want to support us?

Make a small donation by buying us coffee ($5) or help with server cost ($10)

Donate via Paypal

Or Donate anonymously using crypto!

Ethereum

0xfe58350B80634f60Fa6Dc149a72b4DFbc17D341E copy

Bitcoin

3ATGMxNzCUFzxpMCHL5sWSt4DVtS8UqXpi copy

Thank you for your support!

Follow Us!

:(