
SWING TRADING STRATEGY FOR RANGE BOUND STOCKS
A Thread :
Using Concept of Support and Resistance
Using Minimum StopLoss
Retweet And Share !
1/n
A Thread :
Using Concept of Support and Resistance
Using Minimum StopLoss
Retweet And Share !
1/n
THESIS:
📌We are looking for stocks that are in consolidation
📌These stocks when hit demand zone provide excellent Risk Reward opportunity
📌These will be all key moving averages hence will not be in momentum
2/n
📌We are looking for stocks that are in consolidation
📌These stocks when hit demand zone provide excellent Risk Reward opportunity
📌These will be all key moving averages hence will not be in momentum
2/n
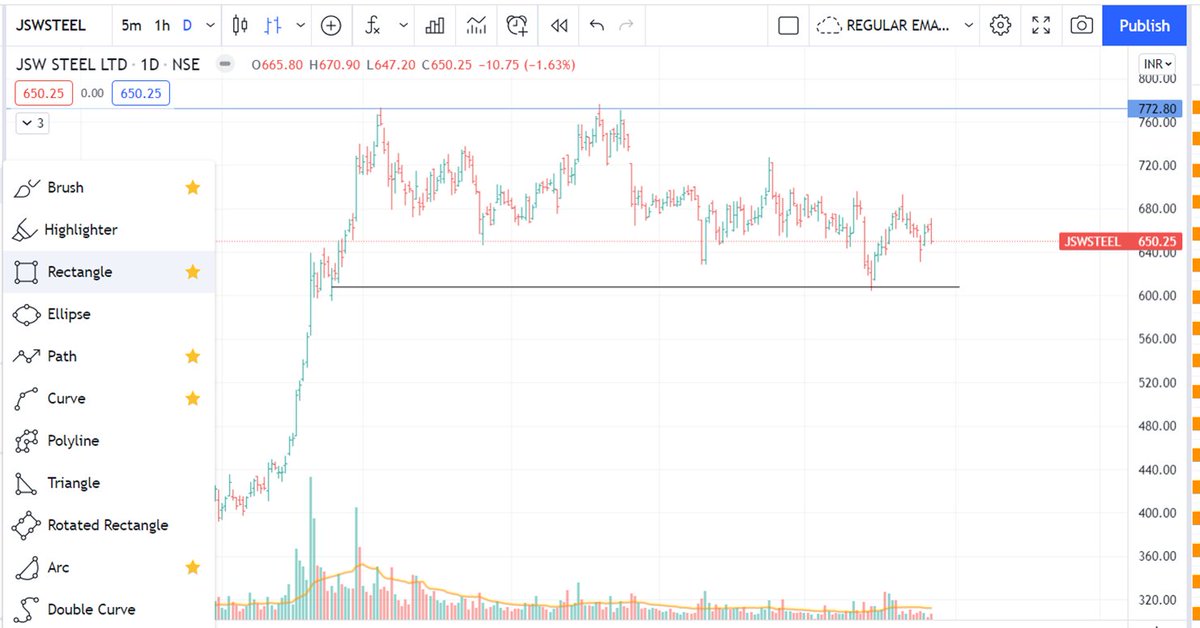
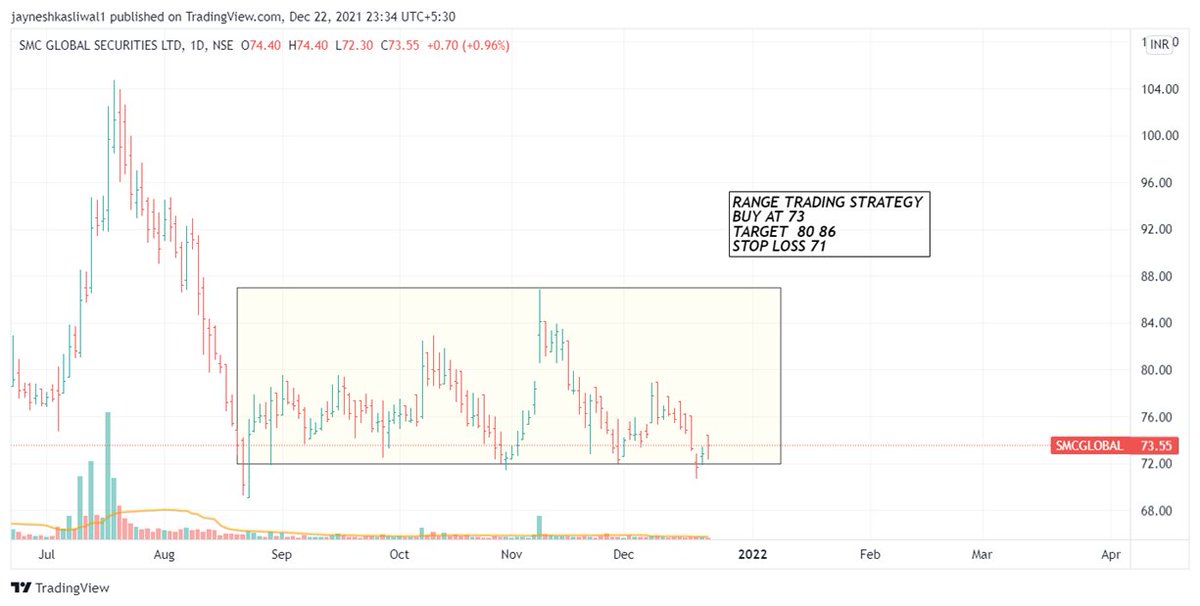
How to draw?
📌Look for stocks that are in consolidation for a very long time
📌Use Rectangle tool to make a range for the box from high to low of the price
⌛️Keep alerts at higher point of support and Buy when the alerts hit .
📌We are using the simple concept of Support.
3/n
📌Look for stocks that are in consolidation for a very long time
📌Use Rectangle tool to make a range for the box from high to low of the price
⌛️Keep alerts at higher point of support and Buy when the alerts hit .
📌We are using the simple concept of Support.
3/n

Entry Rules :
⏫Entry Should be as close to support as possible
⏬To keep Minimum Stoploss Its Advised to Buy Near support and not in between the range
✅Bigger the consolidation , stronger the support
🛑Can be used for Longer form of trading , and not Swing Trades
4/n
⏫Entry Should be as close to support as possible
⏬To keep Minimum Stoploss Its Advised to Buy Near support and not in between the range
✅Bigger the consolidation , stronger the support
🛑Can be used for Longer form of trading , and not Swing Trades
4/n
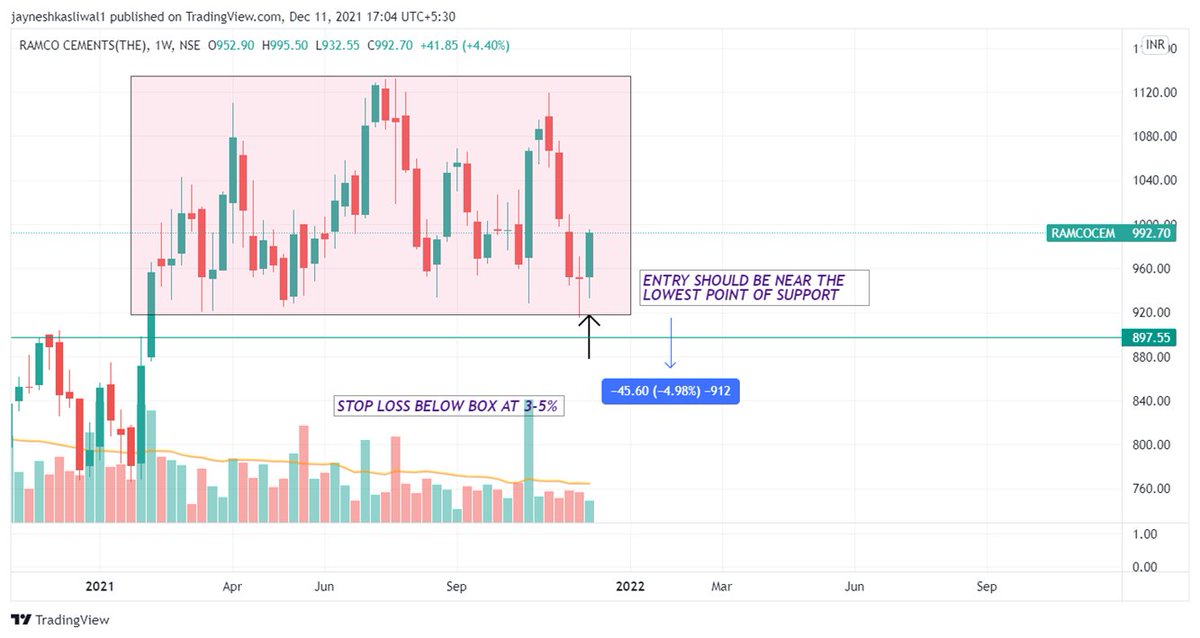
STOP LOSS
1. Ideally your stoploss should be max 8% from your buy point
2. The closer you buy near support , the smaller the stoploss
3. Do not buy in between the range as you will get stuck in between for a long time
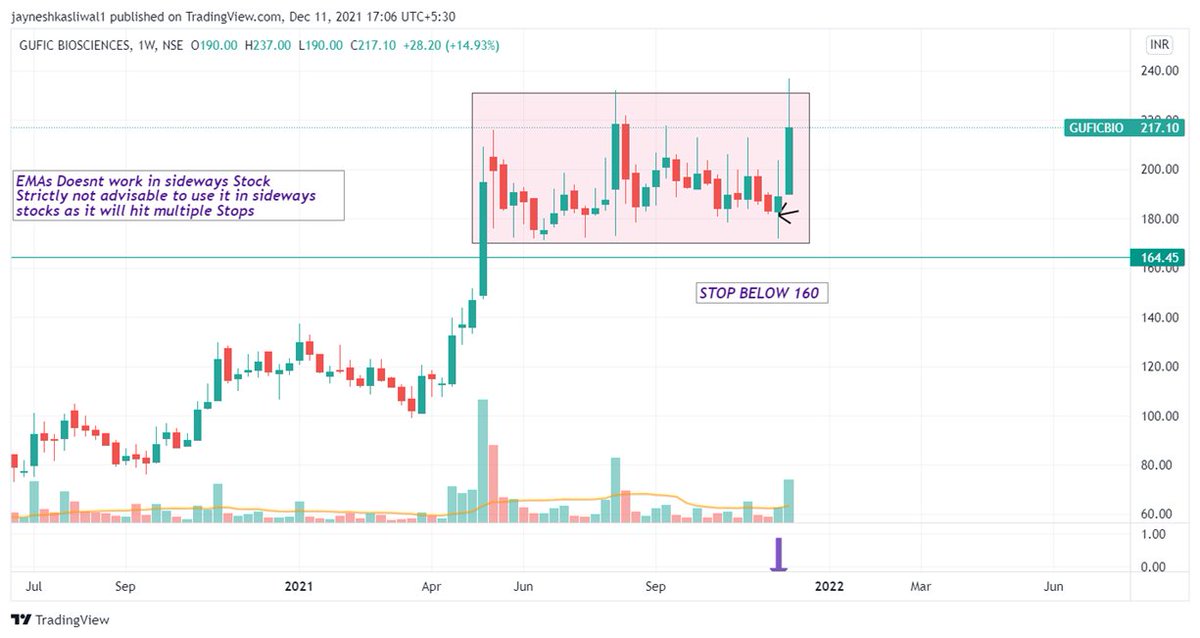
4. Moving Averages dont work as stoploss in sideways
5/n
1. Ideally your stoploss should be max 8% from your buy point
2. The closer you buy near support , the smaller the stoploss
3. Do not buy in between the range as you will get stuck in between for a long time
4. Moving Averages dont work as stoploss in sideways
5/n


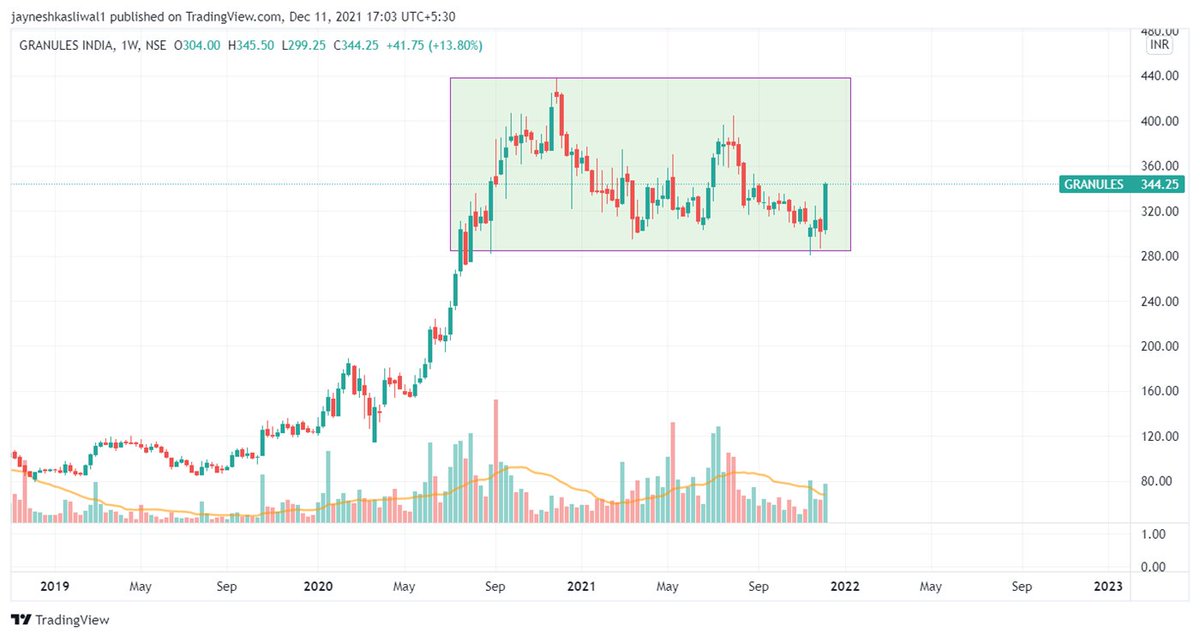
TARGETS :
Risk Reward 1:2 will easily be acheived
One can even wait for box breakout
Generally Stoploss in my cases was less than 5% when buy point was accurate hence Reward was > 1:3
6/n
Risk Reward 1:2 will easily be acheived
One can even wait for box breakout
Generally Stoploss in my cases was less than 5% when buy point was accurate hence Reward was > 1:3
6/n


@kuttrapali26 @AnshumanCharts @AmitabhJha3 @Puretechnicals9
@chartworldat @rohanshah619
Join Telegram
t.me/Techno_charts
@chartworldat @rohanshah619
Join Telegram
t.me/Techno_charts
• • •
Missing some Tweet in this thread? You can try to
force a refresh


