1. Weekend Reading (Special Holiday Edition): "When Does USDA Information Have the Most Impact on Crop and Livestock Markets?" Article published in the Journal of Commodity Markets in 2021. sciencedirect.com/science/articl…
2. Back story on this article centers on the argument by some that the rise of "big data" private sector companies made USDA reports redundant. Putting aside the obvious private incentives of people in big data firms making this argument, it is worth taking seriously.
3. Then Chief Economist of the USDA Rob Johansson asked a group of us to undertake a rigorous investigation of the idea that USDA crop and livestock reports had become redundant in the new "big data" era. We decided to do three different types of tests.
4. I reviewed the first of the three tests in my previous weekend reading thread. That article examined market reaction to the "surprise" component of USDA report information. Here is the link to that paper published in Food Policy in 2019 sciencedirect.com/science/articl…
5. In the second paper and subject of this thread, did the most comprehensive price volatility test of USDA report market impact that I have ever seen. Market reaction to all major USDA reports in corn, soybeans, wheat, cotton, live cattle, and lean hogs over 1985-2018.
6. We could be this comprehensive because all we needed to do was compare price volatility on report to non-report days. No need to have data on pre-report expectations to compute market surprises. I love simplicity and this test is definitely simple.
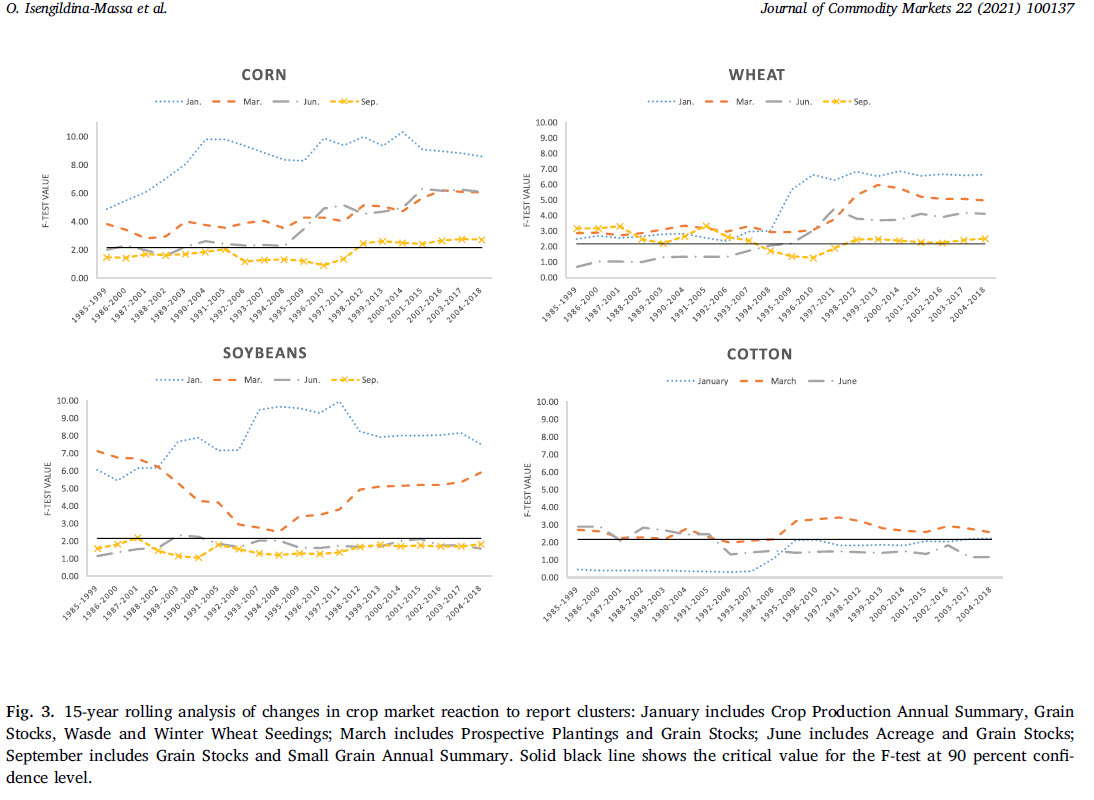
7. Only downside to this method is that some USDA reports released on the same days. So we had to analyze USDA report "clusters" for market impact. This chart summarizes key results nicely. First off, notice how much Jan reports stand out for the grains. Look out Jan 12!
8. Also notice how days with Grain Stock reports and acreage reports in March and June stand out. Big price reactions in grain and cotton markets almost guaranteed on those days.
9. What about declining market reaction to USDA reports over time, which is what the big data people believe? No evidence of declining market price impact over time for USDA grain stocks and acreage reports. If anything, generally INCREASING price impact in recent years.
10. To be fair, some evidence of declining price impact of crop production reports in the four markets. But still a statistically significant price impact in most cases.
11. So, are the big data people right? Are USDA reports redundant? Definitely not true in grains and cotton. Livestock is another story. Take a look and see what you think! sciencedirect.com/science/articl…
1. Recommended Reading for the Day: “Containergeddon” and California Agriculture by my old friend Colin Carter of UC-Davis and co-authors. One of the more interesting COVID-related studies I have seen to date. CA ag really took it on the chin here. s.giannini.ucop.edu/uploads/pub/20…
2. Don't want to spoil the fun of reading the entire article, so will just re-post one chart. Notice the huge wedge between container freight rates to and from China to CA. Incredible. More profitable to ship empty containers back to China and return quickly to US.
3. Here is your statistic for the day from the article: "Recently, for every ten containers inbound from Asia with freight, approximately eight were sent back empty."
1. Weekend Reading: Continuing theme of the value of USDA reports. Fast forwarding to recent research rather than my older stuff. Up next is, "Are USDA reports still news to changing crop markets?" 2019 Food Policy paper. Several great co-authors. sciencedirect.com/science/articl…
2. Background: old question with a new twist. People have been questioning the value of USDA crop reports forever. Been examining that question pretty much my entire academic career. In the last decade or so a new twist on that line of attack emerged.
3. Last decade has seen the rise of "big data" companies that use satellite remote sensing data, lots and lots and lots of other weather data, and super sophisticated statistical modeling in order to forecast acreage and crop production. Some see this as making the USDA obsolete
1. Yesterday had some fun commenting on the SECOND FINAL RVO for 2020 from the Biden EPA. Today I'm going to look at the broader question of the volume and value of the RIN relief provided to refiners in the latest rulemaking for 2020 and 2021.
2. Here is my recap of 2020. EPA rolled back the total renewable RVO by 1.4BG more than would have happened with the automatic downward adjustment due to COVID pandemic under the FIRST FINAL RVO for 2020. That is a good estimate of the gallons given to refiners for that year.
3. Now what about 2021? The Biden EPA did not have to adopt the cockamamie logic of COVID, the little reset, and lateness to crush the 2021 RVOs. It is important to be clear that the Biden EPA did not have to do this. It was a simply a choice.
1. My last thread walked through the numbers on the SECOND FINAL RVO for 2020. Now lets think about what happened more from a regulatory standpoint. EPA had a FIRST FINAL RVO for 2020 and then proposed going back and retroactively changing it to a SECOND FINAL RVO.
2. Here is a way to think about it. A parent says to a child. Here is a family rule, break it and there will be this consequence. The child breaks the rule and the parent says at first the consequence is still in play but I am going to wait to enforce it for awhile.
3. After awhile, the parent goes back and changes the rule so that there is no consequence whatsoever for the misbehaving child. Now what kind of behavior do you think that will lead to in the future for the child?
1. Think it is important to understand what just happened to the 2020 RVOs in yesterday's EPA rulemaking. Here is a link to the rulemaking (warning don't print it out unless you want to use a lot of paper) epa.gov/sites/default/…
2. So let's review. The EPA issued a final rulemaking on the 2020 RVOs in late 2019 under the Trump Admin. We thought it was FINAL. The first column in the chart shows the RVOs in that FINAL rulemaking. Implied conventional (corn ethanol) was at the statutory level of 15BG.
3. Once the RVOs in gallons are finalized, then they are enforced in % terms on obligated parties (refiners). The base for the % RVOs is projected gasoline and diesel use in 2020 with some adjustments. That base number was 173.82BG in the FINAL rule.
1. Different quick take on the RVOs just released today. Try to shed some light on just how much did Biden EPA crush the RVOs in the rulemaking for 20-22? To start, I use the final previous 2020 RVO of 20.090 as the benchmark. I call it the status quo.
2. I then take the difference between the 20.09BG benchmark and total RVOs for each year over 2020-22. Simple. That nets out to a cut of 3.85BG in total for the three years. May I say YUUUUGE.
3. EPA also finally going back and addressing the 2016 remand from the July 2017 court case (gee only took 4 yrs). Adding on 250MG in 2022 and 2023. I am interpreting that as additional to stated total RVO. Still need to check further.