ONS data published today on booster vaccination take-up by demographic group shows that even amongst those who've had 2 doses, there is still a marked divide.

By ethnicity there's a very wide range, from as little as 50% up to 80% for white British.

1/
There's a much tighter range by religion, with the exception of Muslim, which is a full 20% lower than the second lowest.

2/
There will of course be a high degree of correlation between these different groupings. Here we see the usual pattern by deprivation, although again the spread is less wide - only 12%.

3/
Next by employment status, with those not working the least likely to have had a booster.

4/
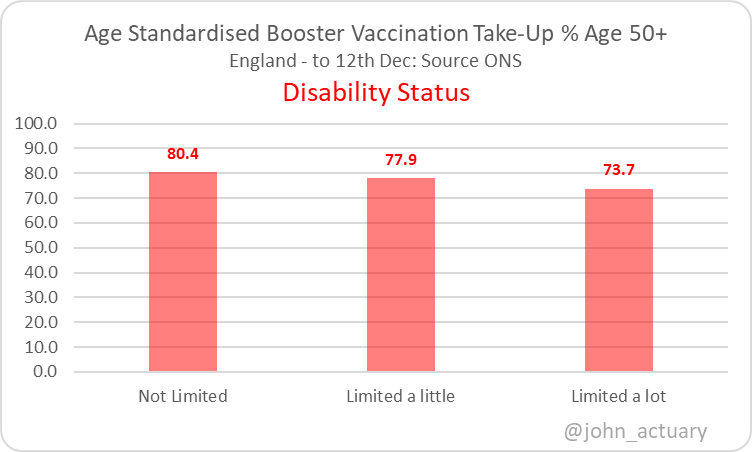
Finally by disability status, where it's clear that the less mobile have had greater difficulty accessing the booster, consistent with reports that home visits were less available during the early stages of the roll-out.

5/
The reasons for the differences can be debated, but it's worth remembering that the denominator is all those double vaccinated, so any initial hesitancy about the vaccine has been overcome with this population.

6/
Access is likely to be a key factor, and hopefully since Dec 12th the rapid roll-out has enabled a wider distribution of sites. Nevertheless the study is a reminder of the need to engage with all parts of the community to increase coverage more evenly.

7/
Study here, with a link to the data.

8/8
ons.gov.uk/peoplepopulati…

• • •

Missing some Tweet in this thread? You can try to force a refresh
 

Keep Current with John Roberts

John Roberts Profile picture

Stay in touch and get notified when new unrolls are available from this author!

Read all threads

This Thread may be Removed Anytime!

PDF

Twitter may remove this content at anytime! Save it as PDF for later use!

Try unrolling a thread yourself!

how to unroll video
  1. Follow @ThreadReaderApp to mention us!

  2. From a Twitter thread mention us with a keyword "unroll"
@threadreaderapp unroll

Practice here first or read more on our help page!

More from @john_actuary

24 Dec
Xmas Eve 🏴󠁧󠁢󠁥󠁮󠁧󠁿booster/3rd primary update:

A disappointing 493k today, down a third on last week, breaking the stellar run we've seen in the last 10 days.
Maybe it's a Xmas effect, but we can't afford too much down time over the festive period.

Total is now 27.1m.

1/
We can see the effect here, with the weekly total turning down. From here on it's going to be somewhat distorted by the Xmas period, so is likely to be of less value. I've assumed there will be little activity on 25th/26th, even if some centres are open.

2/
The pale blue "to dos" now total just over 10m, but realistically, assuming 90% take-up, it would be around 6.5m.

With 6 full-ish jabbing days left, that's no longer likely, especially as many will be infected and not able to come forward anyway.

3/
Read 6 tweets
24 Dec
Two ONS infection survey updates in two days - it must be Xmas.

It's only advanced by 3 days, but we can see large increases in E/W/NI.

1.5m are estimated to be infected in England over the period 13th to 19th Dec.

But there's more...

1/
The 🏴󠁧󠁢󠁥󠁮󠁧󠁿figure of 2.83% is an average over the previous week. Looking at the data, the latest estimate, for the 19th, is 3.76%, up 77% on a week earlier.

And there's more still...

2/
London is estimated at a staggering 9.5%, three times the rate of just a week ago.

Remember that the current level of admissions won't reflect much of this growth, and we are 5 days further on from the latest point shown here.

3/
Read 4 tweets
23 Dec
Some very dodgy maths in the @Mailonline suggesting that two thirds of those admitted with COVID recently were actually admitted for another reason.

It's nonsense, as all they have done is difference the figures between the two dates.

Let's take a look.

1/
From the primary diagnosis data from the NHS, I sort of agree the figures of 563 and 197, (except they've used the wrong starting date, but that's not the issue here).

Thus the Mail concludes that 366 (65%) were admitted for non-COVID reasons over 15 days.

Why is it wrong?

2/
It's wrong because it assumes no discharges over the period. Let's take a simple example to illustrate that.
In the scenario shown, the Mail would conclude that nobody has been admitted with COVID as the primary cause, and thus assume ALL new admis'ns were for other reasons.
3/
Read 5 tweets
23 Dec
Thu🏴󠁧󠁢󠁥󠁮󠁧󠁿booster/3rd primary update:

695k reported today, up just 11%, but after last week's 84% increase it still means it's more than double the figure of two weeks ago.

Total is now 26.6m, being 71% of those eligible by the year end.

1/
The low % increase today means a flattening of the previous steep curve over the last 10 days, which isn't at all surprising.

Whilst we haven't quite hit the target to get 90% done, in practice I doubt take-up will be that high, particularly amongst younger adults.

2/
Next the age-banded analysis, with the dark purple showing progress since the accelerated campaign started. Pale blue bars now sum to just over 10.5m, or just under 7m if 90% come forward in aggregate.

3/
Read 6 tweets
23 Dec
The latest ONS infection survey shows a sharp increase in England, driven by London growth, with a lower % increase in S, and broadly flat figures in W/NI.

Data is to Thu 16th.
E🔼from 1.72% to 2.21%
W↔️ from 1.85% to 1.79%
NI ↔️ from 2.02% to 2.06%
S🔼from 1.27% to 1.45%

1/ Image
Starting with London, the attached dataset shows that the modelled increase is over double in the latest 7 days.

Remember this is prevalence, which will typically lag infections in times of high growth (or fall).

2/ Image
It's a shortened report this week, without the usual graphs, but it does include this one, showing the rapid rise of Omicron, with E and S ahead of W and NI.

3/ Image
Read 5 tweets
23 Dec
Latest data on the prop'n in hospital with COVID the primary diagnosis does show a recent fall for London (red) from 84% to 74% over 2 weeks, suggesting that more are being admitted with COVID as an incidental condition. (Note the y-axis scale to make the position clearer).
1/ Image
However, in London the number of beds occupied with COVID the primary condition has still risen by 37% in the week.
So an increase in "incidental COVID" cases only explains a small part of the overall increase we have seen.

2/ Image
We might expect incidental admissions to rise in line with current infections - admissions from COVID will have the usual lag of a few days, so much of the recent steep increase in case numbers is yet to feed through in COVID related admissions (and thus beds occupied).

3/
Read 4 tweets

Did Thread Reader help you today?

Support us! We are indie developers!


This site is made by just two indie developers on a laptop doing marketing, support and development! Read more about the story.

Become a Premium Member ($3/month or $30/year) and get exclusive features!

Become Premium

Too expensive? Make a small donation by buying us coffee ($5) or help with server cost ($10)

Donate via Paypal

Or Donate anonymously using crypto!

Ethereum

0xfe58350B80634f60Fa6Dc149a72b4DFbc17D341E copy

Bitcoin

3ATGMxNzCUFzxpMCHL5sWSt4DVtS8UqXpi copy

Thank you for your support!

Follow Us on Twitter!

:(