1/6
This thread is about what is, and what the current policies are leading to. Not what should be.
The world set a new daily record yesterday.
This thread is about what is, and what the current policies are leading to. Not what should be.
The world set a new daily record yesterday.

2/6
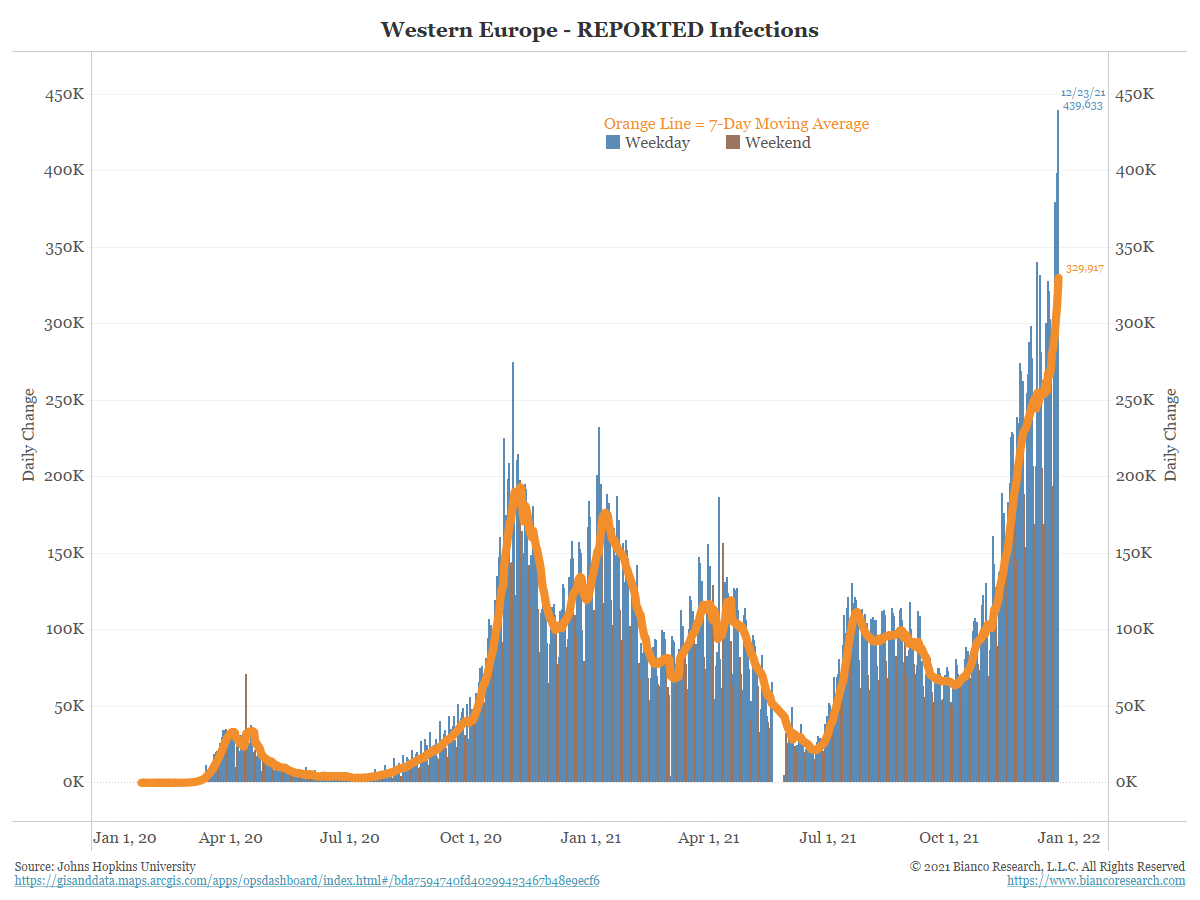
Leading this record is the parabolic spike by Europe.
7-day quarantines are mandatory for positive cases.
Leading this record is the parabolic spike by Europe.
7-day quarantines are mandatory for positive cases.
3/6
And leading Europe to new records is the UK, Italy and Spain.
And leading Europe to new records is the UK, Italy and Spain.


4/6
Many pointing to South Africa peaking. Remember this was after a 100x increase in 30 days. Maybe they hit testing limits after this massive rise? Consider:
The last two days SA cases are heading up again.
The rest of Africa is going vertical and also setting new records.
Many pointing to South Africa peaking. Remember this was after a 100x increase in 30 days. Maybe they hit testing limits after this massive rise? Consider:
The last two days SA cases are heading up again.
The rest of Africa is going vertical and also setting new records.


5/6
Asia, and especially China, has zero COVID, one case and everything closes.
Xi'an, a city of 13 million (>than NYC) is closed, because of 127 cases over one week!
Asia, and especially China, has zero COVID, one case and everything closes.
Xi'an, a city of 13 million (>than NYC) is closed, because of 127 cases over one week!


6/6
Positive tests
US 10-day quarantine
Euro 7-days quarantine
Asia, zero policy (lockdowns!)
You think the global supply chain is "challenged" now, let's remove billions and billions of workdays from global production in the coming weeks and see what happens to it?
Positive tests
US 10-day quarantine
Euro 7-days quarantine
Asia, zero policy (lockdowns!)
You think the global supply chain is "challenged" now, let's remove billions and billions of workdays from global production in the coming weeks and see what happens to it?
• • •
Missing some Tweet in this thread? You can try to
force a refresh