Alex Barrow 🪶 Profile picture
Dec 27, 2021 9 tweets 5 min read Read on X
Here's a few charts I'm looking at this week pulled from the #DirtyDozen.

1. Nasdaq New Highs - Lows dropped to levels earlier this month that typically coincide with a double-digit selloff.

However, the Qs only managed to drop approx. 7% peak to trough.
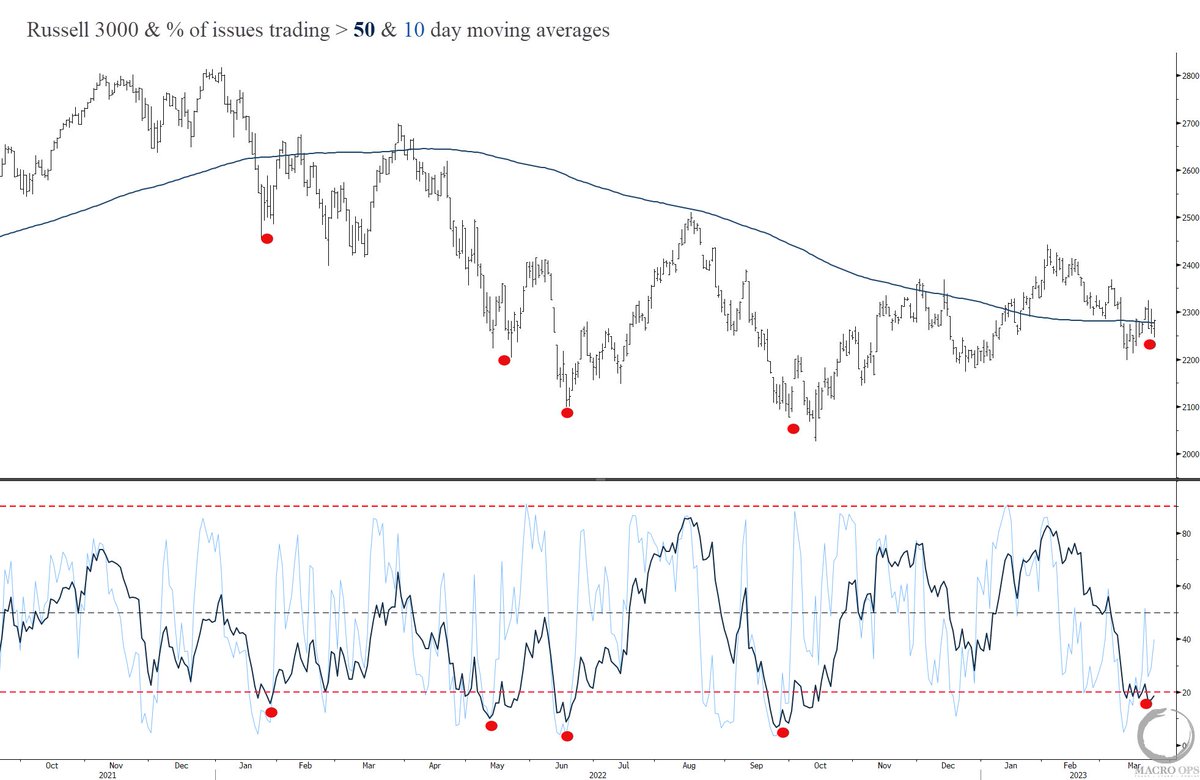
2. Similarly, R3K % stocks > 50-day MAs are rebounding from oversold levels that typically mark intermediate bottoms. Again, despite the index being near highs.

I read this as short-term bullish as there's now a propensity we see a snapback in breadth which supports the trend⬆️
3. We break down each market by its technical regime using the SQN (BullV, BullQ, Neutral, BearQ, BearV).

The most profitable markets for our style of position trading are blended Bull regimes (bullQ + neutral).

Here's an overview from our dashboard.
4. We have a tool that shows the forward avg returns for each asset per its current regime. Currently, the markets w/ the highest projected 20-day returns are $CL_Z $XHB $SMH and $QQQ.
5. $MU is back nearing new highs following months of increasingly bearish sentiment.

The chart is building into an accelerating parabola. The next MM target is $124 a share. I wrote up the bull case for semis & $MU in Sep 20', which you can find here macro-ops.com/underwriting-t…
6. If $EURUSD closes negative in Dec it'll be the 5th consecutive monthly bear bar. Past instances have shown a strong bullish bias over the following 12-months.
7. My view is that the $DXY is setting up for a fade soon. One pair I'm looking at here is $GBPUSD. It just broke up and out from a 3-wave down wedge

• Speculators have crowded into shorts
• Yield spread oscillator turning up in favor of GBP
• Momentum turning up from flat
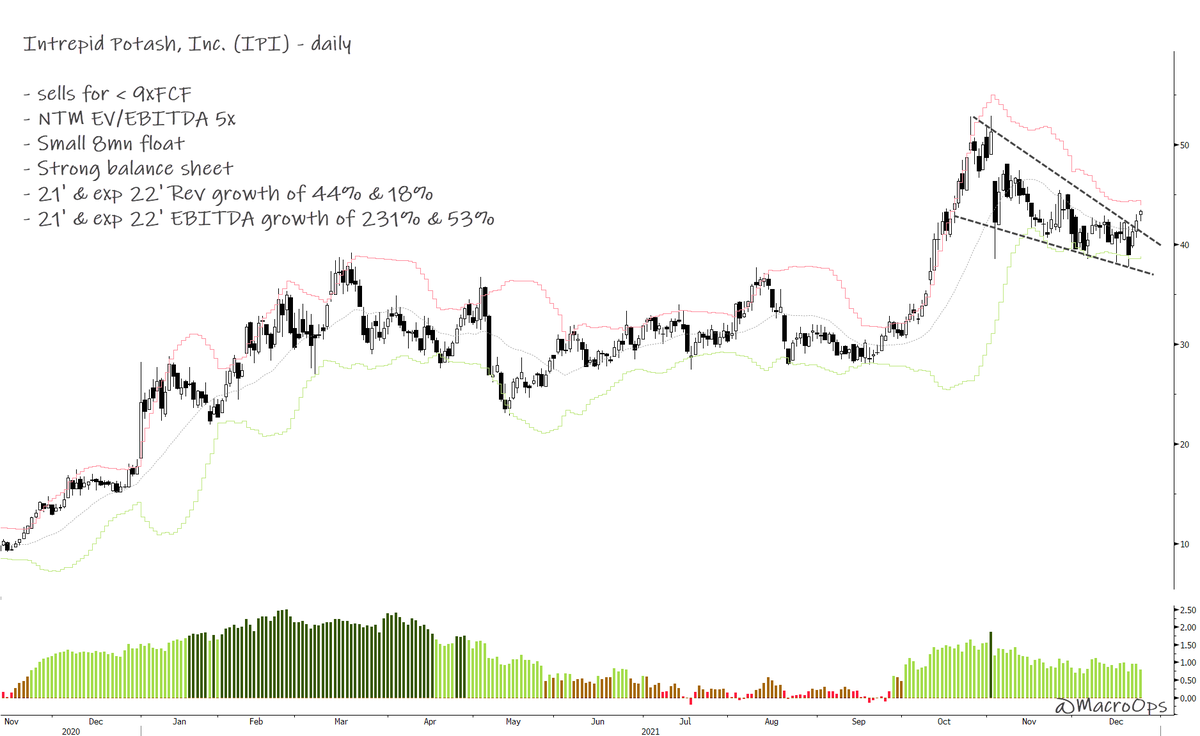
8. Corn and related softs are starting to perk up again.

We're seeing similar strength in Ag related equity names. Two that we have positions in are (1) Intrepid Potash $IPI, which also benefits from higher oil prices thru its large water rights and $BIOX
To sum up: the path of least resistance remains up

We're in the 3rd leg of a major Buy Climax. Climaxes tend to surprise w/ their durability

We have not yet triggered preconditions for a larger top

Stay safe & keep yo head on a swivel!

Read full note: macro-ops.com/a-stealth-bear…

• • •

Missing some Tweet in this thread? You can try to force a refresh
 

Keep Current with Alex Barrow 🪶

Alex Barrow 🪶 Profile picture

Stay in touch and get notified when new unrolls are available from this author!

Read all threads

This Thread may be Removed Anytime!

PDF

Twitter may remove this content at anytime! Save it as PDF for later use!

Try unrolling a thread yourself!

how to unroll video
  1. Follow @ThreadReaderApp to mention us!

  2. From a Twitter thread mention us with a keyword "unroll"
@threadreaderapp unroll

Practice here first or read more on our help page!

More from @MacroOps

Apr 17, 2023
The tape and macro conditions continue to be supportive of higher prices over the near term.

BofA’s Bull & Bear Indicator is just a few points from triggering a buy signal... 1/ Image
2/ Our Trend Fragility indicator (a composite of sentiment, positioning, and flows) hit a low of 11% a few weeks ago, which is just 1% away from the 10% needed to trigger a classic buy signal.
3/ Below is one of the Trend Fragility indicator components which shows aggregate index fund flows as a percentage of its 3yr average.

This indicator triggered a buy signal last week. Green dots mark past signals and red dots mark past sell signals. Image
Read 8 tweets
Mar 27, 2023
My base case is we’re in a primary bear market and we should enter a recession in the latter half of this year, though odds say we should see a continued bullish counter-trend move over the coming weeks... 1/
2/ With that said, looking at charts like those below makes me uneasy about my bearish bent.
3/ In support of our short-term bullish view, here’s a chart of the Russell 3k and the percentage of stocks above their 10 and 50-day moving averages.

Red dots mark instances where both the 10 and 50-day indicators dip below the 20% level, indicating deeply oversold breadth.
Read 7 tweets
Mar 13, 2023
Sentiment and positioning remain very depressed. Last week’s SIVB freakout likely marks a near-term low.

Market internals (Cyc vs Def, Semis v SPX, etc.) are not leading to the downside. They’re either leading up or trading in line with the market. That’s not bearish... 1/ Image
2/ The Russell chart is broken because of the knee-jerk reaction in financials last week following the SIVB news. It’ll be important to see if IWM can retrace that damage this week.

But Qs and SPX remain constructive as long as they can hold their current levels. Image
3/ Anecdotally, last week I started receiving texts and calls asking about a potential market crash from friends I don’t normally talk markets with. It seems to me that the bearish hysteria doesn’t quite match the tape.
Read 9 tweets
Feb 27, 2023
The SPX has only two trading days left in the month to see if it can turn its monthly bar around and close in the green. As of now its not looking so good.

Also, the chart is coiling in a tight 10-month range. Compression regimes lead to expansionary ones (aka. Big trends)... /1 Image
2/ We’re fairly neutral in our short-to-intermediate term outlook. So we’ll wait for the market tip its hand on this one. Bonds will be the tell. If they can’t hold a line, then neither will stocks.
3/ It's not all bad though… key internal leads continue to hold up well. Typically we’d see cyclicals, semis, corporate debt, etc… underperform on a relative basis if we are in fact about to start another leg lower. And that’s just not happening, yet. Image
Read 6 tweets
Feb 21, 2023
Our weekly Nervous & Number Indicator, which is a measure of the relative changes in SPX and the VIX, looks like it’ll trigger a sell signal this week.

Red circles mark past signals... /1 Image
2/ For those who think we’ve started a new cyclical bull market... NOPE.

You don’t have cyclical bottoms when aggregate median valuations are in the 88th percentile and the Fed is still in the midst of its most aggressive hiking cycle in decades: Image
3/ We turned cautious two weeks ago for a number of reasons (short-term extension, significant resistance, yields breaking down, etc…)

Another one of these reasons is seasonality, which is quite negative for the SPX until March 10th. Image
Read 6 tweets
Feb 6, 2023
SPX is short-term overextended and at resistance (it’s upper weekly Bollinger Band + a significant monthly level that has rejected price since last Spring).

We believe it'll punch through, but we’ll likely see a small pullback or consolidation first, so expect some chop and vol.
2/ Key to watch: Momentum and short-term breadth indicators such as those below. These collectively signaled failed bullish breakouts on each of the last market advances over the past year. They are strong for now, but we’ll have to see how they hold up in the week ahead.
3/ Reminder: Hedge fund positioning remains very light. As the US economy continues to surprise to the upside over the next few months, we’ll see this chart trend up as they chase prices higher = bull fuel.
Read 6 tweets

Did Thread Reader help you today?

Support us! We are indie developers!


This site is made by just two indie developers on a laptop doing marketing, support and development! Read more about the story.

Become a Premium Member ($3/month or $30/year) and get exclusive features!

Become Premium

Don't want to be a Premium member but still want to support us?

Make a small donation by buying us coffee ($5) or help with server cost ($10)

Donate via Paypal

Or Donate anonymously using crypto!

Ethereum

0xfe58350B80634f60Fa6Dc149a72b4DFbc17D341E copy

Bitcoin

3ATGMxNzCUFzxpMCHL5sWSt4DVtS8UqXpi copy

Thank you for your support!

Follow Us!

:(