On Monday the number of COVID cases in the U.S. spiked as labs reopened after the holiday. While this is more a technical spike due to labs catching up from previous days, the seven-day moving average is on the verge of making a new high.
2/7
We have argued policy is a reaction function of rising cases. During this wave, imposed restrictions would mostly result in lost workdays as millions are following government guidelines and isolating.
This chart shows 2.04M tested positive in the past 10-days. If we assume 75% are in the workforce (few under 18 test positive), then 1.04% of the workforce is currently “out” with a positive test.
So, the effective unemployment rate just spiked 1.04% in the last 10-days.
4/7
As the WSJ noted, this is global problem. And the problem for the economy might be worse outside the US. (Read: supply chain and >inflation)
Start with this headline that recently crossed ...
*WORLD HITS RECORD DAILY COVID CASES AS OMICRON MARS CHRISTMAS
5/7
China might be the biggest ECONOMIC story right now.
It has a strict zero COVID policy and the Olympics are 6-weeks away.
Will a COVID spike now give the world an excuse to cancel the games?
Will China shutdown the "beginning of the supply chain" in the coming weeks?
6/7
Most do not believe the scale above (missing 000s?) but think the "shape" is right.
less than 200 cases in Xi' an (13 million), >NYC, and it is shut with 30K now in a "COVID Hotel."
tl:dr, Liquidity in the plumbing of the financial system is getting scarce. It is not a crisis now, but it has been moving in this direction for weeks, and it is now at a worrisome point.
When the financial plumbing gets stressed, it is when bad loans (aka "cockroaches") get noticed.
(long thread, tried to write it so "normies" can follow.)
---
Wall Street is famous for diagnosing symptoms, not causes. I believe they are doing this again with the banking issues of the last few days., I do not think this is a "cockroach" problem (bad credit/loans) waiting to get disclosed publicly.
It is a liquidity problem that makes the "cockroaches" matter.
Banks (all 4,000+) hand out a trillion in loans. So, they will always have "cockroaches." So, it is not an issue of whether cockroaches exist; they always do. Instead, it is the environment in which such disclosures are made. Does the market care or not?
Now it cares. Why?
---
@NickTimiraos said below:
How to define "temporary" and "modest." Repo rates in the last two days have moved up to the top of the fed-funds range and around 10 bps above IORB, but it's only been two days.
---
I would argue it has not "only" been two days; worsening liquidity in the funding market has been unfolding for weeks. It just got noticed in the last two days.
This chart shows Secured Overnight Financing Rate, or SOFR (orange), and Interest on Reserves, or IOR (blue). The bottom panel shows the spread between these two, along with some metrics (dashed line = average, shaded area = standard deviation range).
See the arrow; this spread (3-day average, so it is less noisy) has been tightening for weeks. This spread moved to positive territory in early September and has remained there for weeks. The last time it was positive for this long was in March 2020 (not shown).
2/6
A positive spread is typical around month- and quarter-end "window dressing," when financial institutions need to report their positions and want to show conservative cash positions. Now it has been weeks, and it is in the middle of the month.
This chart shows that liquidity has been worsening for weeks. It was two days ago that it finally got noticed.
But note that Jay Powell noticed it, because in his speech to the NABE Conference three days ago:
Some signs have begun to emerge that liquidity conditions are gradually tightening, including a general firming of repo rates along with more noticeable but temporary pressures on selected dates.
SOFR replaced Libor (London InterBank Offer Rate) two years ago; it is the rate charged in the funding markets (that is, financial institutions that need cash and will borrow to get iInterbank Offer Rate) two years ago; it is the rate charged in the funding markets (that is, financial institutions that need cash and will borrow to get it) for overnight loans collateralized by Treasury Bills) on overnight loans collateralized by Treasury Bill ("Secured"). So these loans carry no credit risk. They are compared to the IOR rate, which is the interest rate the Federal Reserve pays banks on their reserve balances. This means that the spread between SOFR and IOR is purely driven by supply and demand. SOFR comprises three components.
* General Collateral repo Loans
* Tri-party repo (biggest part)
* Fixed Income Clearing Corporation (FICC) cleared bilateral repo
As the bottom panel shows, the SOFR market is now $3 trillion of overnight loans a day. It has doubled in the last two years.
The SOFR market has never been bigger (strong demand), and spreads are moving higher (insufficient supply).
3/6
In a normal SOFR market, when the balance between supply/demand is maintained, SOFR loans should trade at a slight discount to IOR rates (see the average and standard deviation range in the bottom panel of the spread chart in the first post). This is because IOR should act as a ceiling on money rates. Banks will not lend out below the IOR rate. Why should they when parking money (reserves) at the Fed offers a better rate?
In a normal market, non-bank (broker/dealers, money market funds, and Government-Sponsored Enterprises, or GSEs, etc.) with money to lend, who cannot park it at the Fed to get IOR rates, will offer it at slightly lower than the IOR rate to anyone that needs cash (to settle trades, needs to put up margin on derivatives, or money for other transactions). They will offer a better deal than IOR, so they do not have to compete with banks for interest on their cash.
Typically, eight basis points below IOR will do it (as the bottom panel shows in the first post), which is the same spread Dallas Fed President Lorie Logan noted in Timiroas' tweet above. Note that before the Dallas Fed, Logan ran the NY Fed Open Market Desk.)
In other words, a negative spread indicates that funding markets are "liquid" and functioning normally. Conversely, an uptrend in the SOFR/IOR spread, which tips to a positive spread, indicates that the supply of cash (aka liquidity) is falling behind the demand for money. So the price (rate) is rising relative to the IOR benchmark.
Restated, liquidity in the plumbing of the financial system is getting scarce. It is not a crisis now, but it has been moving in this direction for weeks, and it is now at a worrisome point.
Remember, financial institutions are highly leveraged; these seemingly little moves can have a significant impact on the P&L and capital ratios.
Why Now?
Why is this happening now? And why should we believe the uptrend in SOFR/IOR will not stop its two-month uptrend?
The answer to the first question is Quantitative Tightening (QT). This is the Fed pulling out liquidity since 2022 by reducing its balance sheet.
As this chart shows, they are now 45% of the S&P 500.
2/4
A list of the stocks
3/4
ChatGPT was released on November 29, 2022.
Since this date, these 41 stocks have accounted for 70% of the increase in the S&P 500's value (blue). The other 30% came from the remaining 359 stocks (orange)
Following every recession, the tenor of inflation shifts.
The current post-COVID recovery, as shown in blue, indicates inflation has reached a significantly higher level, with more volatility (wider standard deviation) than during the post-financial crisis period.
3/6
Something more may be at play, as larger trends in inflation seem to have shifted with the COVID pandemic.
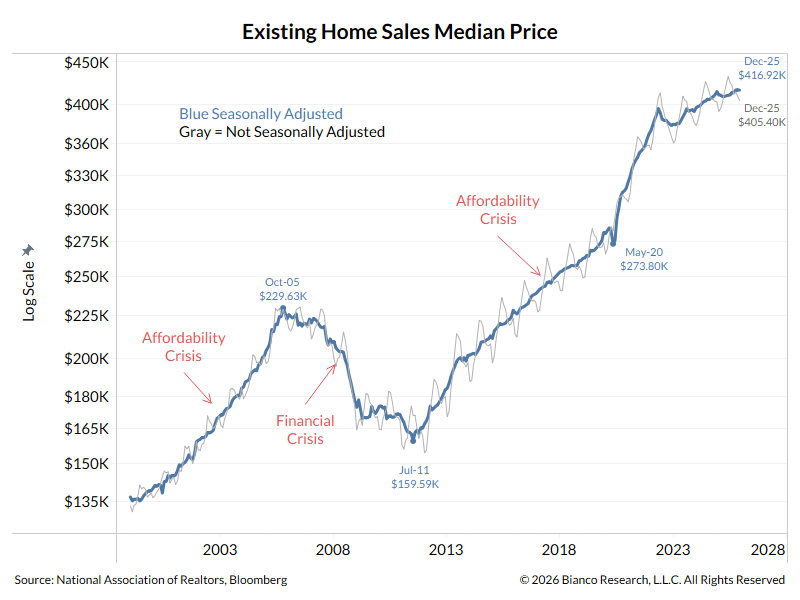
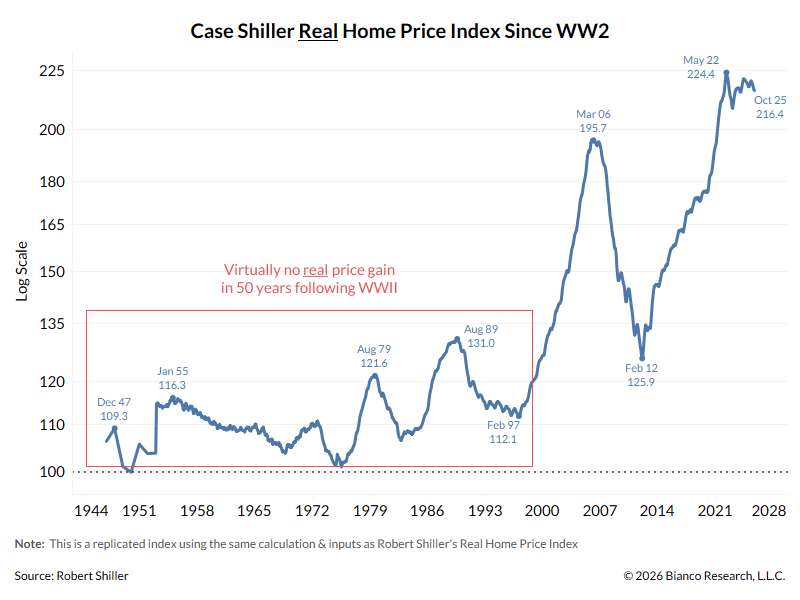
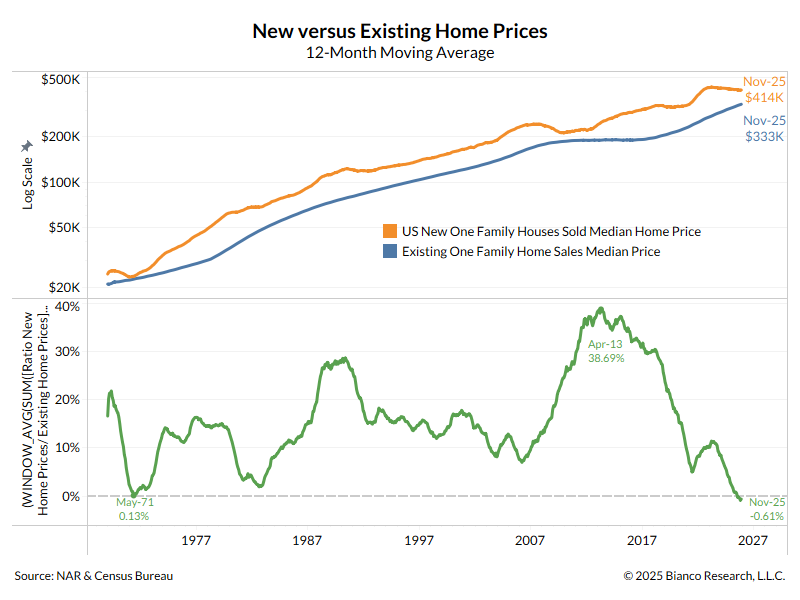
The problem is not mortgage rates, it's inventory (not enough).
Cut rates and home sellers raise prices, and monthly payments remain unchanged. The affordability problem remains. Greedy boomer homeowners get richer.
How to fix affordability?
Reduce zoning and building regulations to increase inventory. The problem is that selfish boomer homeowners wield these laws to restrict supply and drive up the price of their homes.
The Atlanta Federal Reserve calculates a Housing Affordability Monitor.
The median income in the United States (blue) and the income needed to qualify for a mortgage (detailed below the chart). The bottom panel shows the difference.
At 58%, this means one needs 58% more than the median income ($ 83k) to qualify for a median mortgage ($ 130k).
This is a new record, even greater than the peak before the housing crash from 2007 to 2009.
Home prices are too high. Cutting mortgage rates will only incentivize home sellers to increase their asking prices, and the problem persists.
We need more supply, that is what the record "unaffordability" is saying..
A home is considered “affordable” if it costs less than 30% of a household’s income.
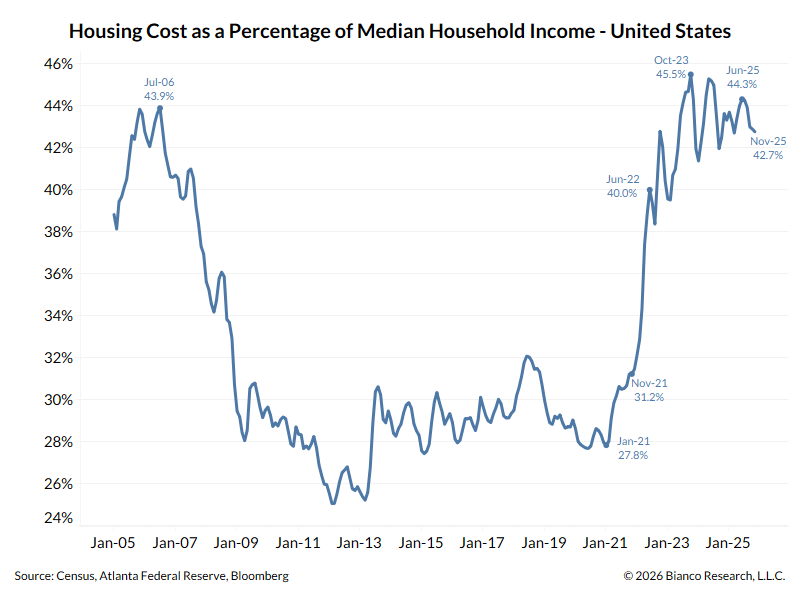
The following chart indicates that the average home in the United States now costs 47% of the median household’s monthly income.
An all-time record, surpassing the bubble peak in 2006 before the housing crash.
The OMB Director and Acting CFPB Director @russvought laid out the charges of lying to Congress and mismanaging the renovation of the Fed (Eccles) building.
While the betting market still has Powell getting fired at less than 50%, it is now trending higher.
--
The Federal Reserve Act says that a Fed Governor (including the Chair) may be removed “for cause by the President.”
However, “for cause” is not defined in the statute and has never been tested in court in this context.
I would argue "for cause" is not a disagreement over Monetary Policy ("too late" cutting rates), but can be lying to Congress and/or mismanaging the rules around renovating the Fed (Eccles) building?
Powell said this to the Senate Banking Committee on June 25, 2025, as part of the semiannual Monetary Policy Report to Congress.
---
"Generally, I would just say we do take seriously our responsibility as stewards of the public’s money. ... There’s no VIP dining room. There’s no new marble—we took down the old marble, we’re putting it back up. We’ll have to use new marble where some of the old marble broke. But there’s no special elevators; there’s just old elevators that have been there. There are no new water features. There’s no beehives, and there’s no roof terrace gardens."
---
Technically, Powell is correct because the renovation has not been completed. However, such details are outlined in some plans for the renovations.
Is this a big deal? No. However, if Trump is looking for ANY reason to remove Powell, this might be enough. And it might be enough "for cause" that the Supreme Court will uphold it.
Furthermore, no one in Congress wants to spend any political capital defending a $2.5 billion marble Washington, D.C. building with private elevators, beehives, and private roof terraces.
---
Bottom line, Powell may have given Trump an opening to remove him. Will Trump take it?
Or, does Trump want/need "Too Late" Powell to stay as Fed Chairman until May 2026 to use as a punching bag?