
1/ Some takeaways on global e-commerce:
E-commerce’s business looks super simple (for 3P, just GMV * take rate), but a lot can be learned on the key assumptions:
- GMV (gross vs. net)
- Take rate (gross vs. net)
- Upside from Ads (%? when?)
- LT profitability (5%? really?)
E-commerce’s business looks super simple (for 3P, just GMV * take rate), but a lot can be learned on the key assumptions:
- GMV (gross vs. net)
- Take rate (gross vs. net)
- Upside from Ads (%? when?)
- LT profitability (5%? really?)
2/ Big Picture
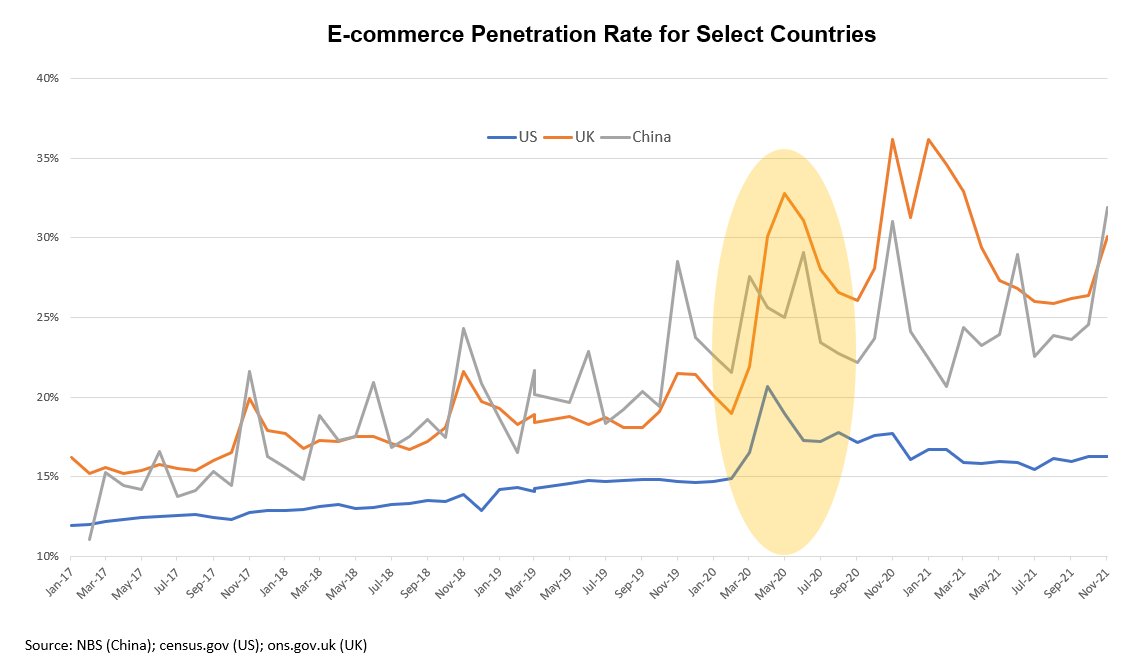
- E-comm is a $5trn market globally
- Est. 30% is 1P
- Online penetration varies: US 16%; China 30%; LatAm & SEA: 10-15%
- Growth varies
- #1 market leader typically captures 50% (AMZN 40%; BABA 60%) of the market but can enjoy 2-4x the amount of profit dollars
- E-comm is a $5trn market globally
- Est. 30% is 1P
- Online penetration varies: US 16%; China 30%; LatAm & SEA: 10-15%
- Growth varies
- #1 market leader typically captures 50% (AMZN 40%; BABA 60%) of the market but can enjoy 2-4x the amount of profit dollars


3/ Big Picture (con'd)
1P vs 3P
1P:
- 3C + FMCG
- Brand matters, consumer preferences are uniform
- Win on quality, price, and service (logistics) quality; not on SKU variety
3P:
- Beauty + Apparel; Suitable for long-tail merchants
- Easier to scale; win on selection/variety
1P vs 3P
1P:
- 3C + FMCG
- Brand matters, consumer preferences are uniform
- Win on quality, price, and service (logistics) quality; not on SKU variety
3P:
- Beauty + Apparel; Suitable for long-tail merchants
- Easier to scale; win on selection/variety
4/ GMV
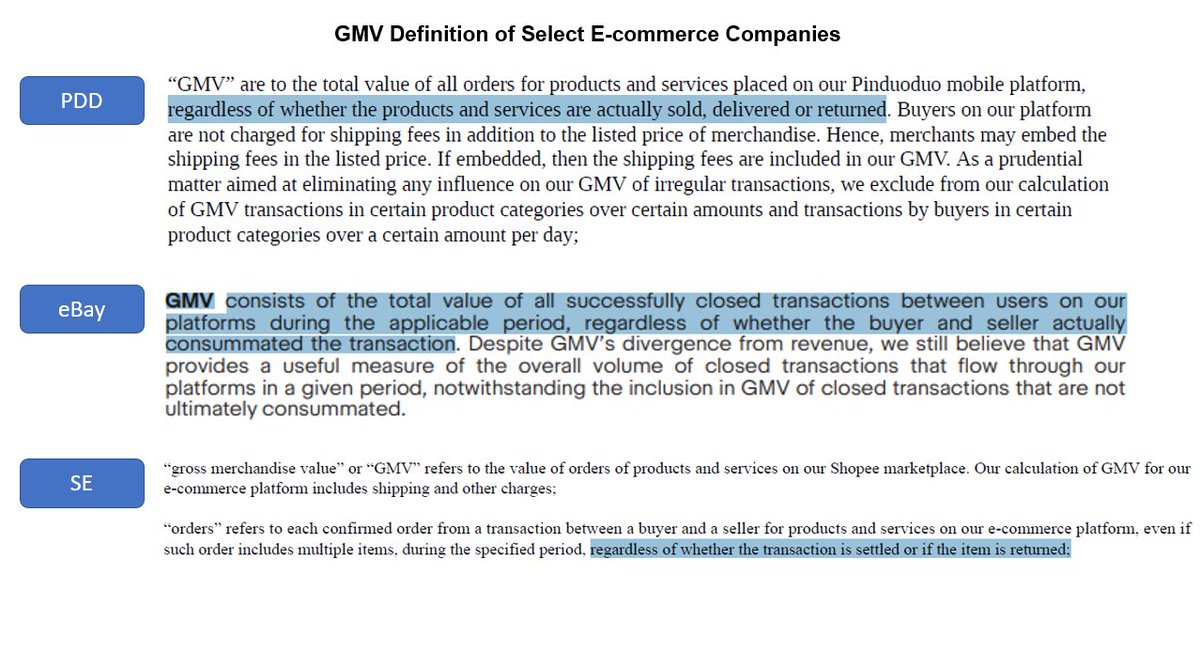
A. Read the footnote
Most include unsold, unsettled, and returned items.
B. Special cases
- Live-streaming (LS) e-comm: high return
- PDD: inflated bc “No shopping cart”+“team order”
Rule of thumb: 20% discount average from GMV to NMV. 40-50% for PDD, 40% for LS e-comm
A. Read the footnote
Most include unsold, unsettled, and returned items.
B. Special cases
- Live-streaming (LS) e-comm: high return
- PDD: inflated bc “No shopping cart”+“team order”
Rule of thumb: 20% discount average from GMV to NMV. 40-50% for PDD, 40% for LS e-comm
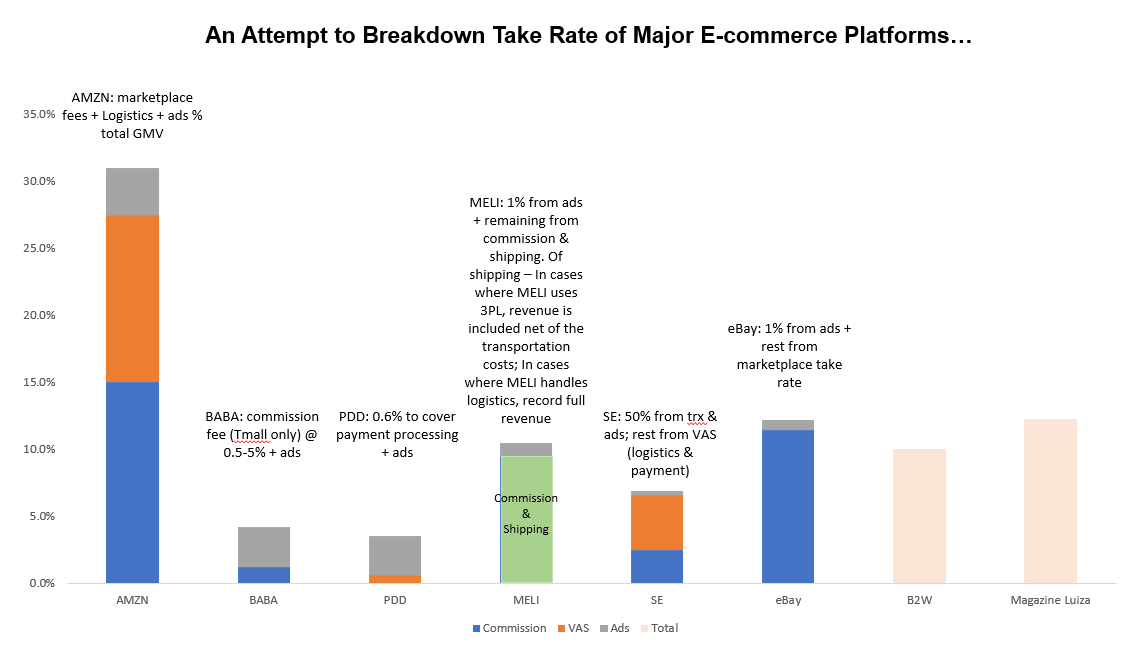
5/ Take Rate
GROSS take rate can be very misleading...
- Some include fulfillment/logistics/payment processing as a part of take rate vs. some don’t…
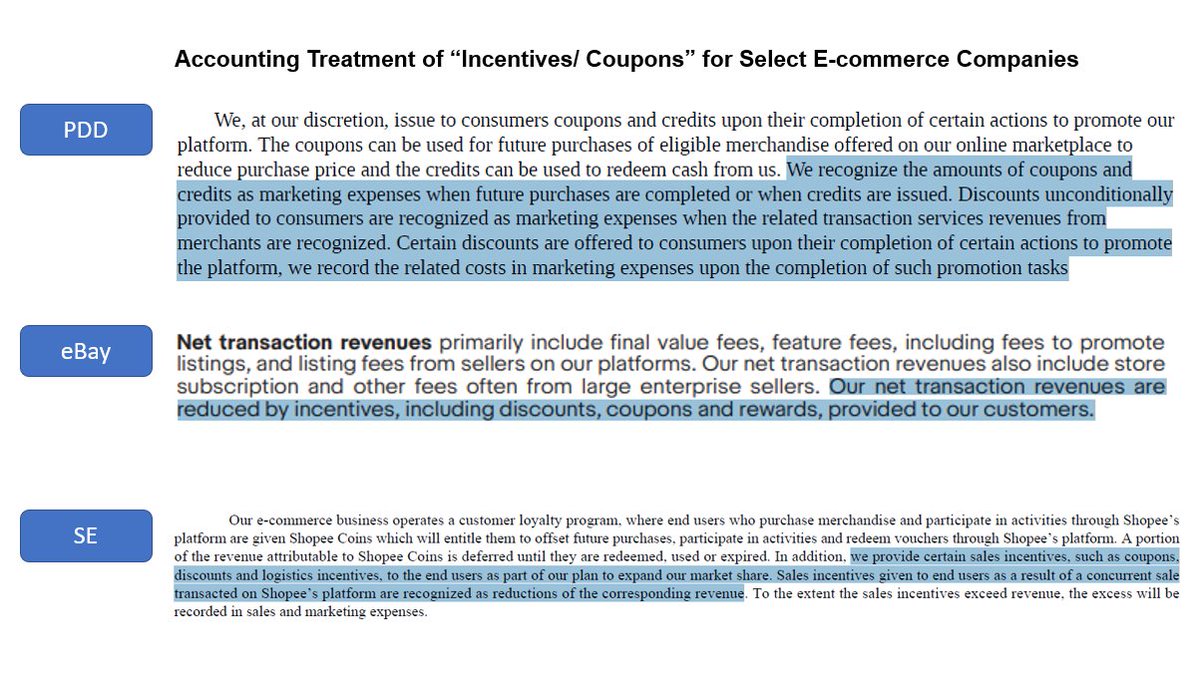
- Some treat sales incentives as contra revenue vs. others treat them as marketing expenses…
Use NET! Do the adjustments...
GROSS take rate can be very misleading...
- Some include fulfillment/logistics/payment processing as a part of take rate vs. some don’t…
- Some treat sales incentives as contra revenue vs. others treat them as marketing expenses…
Use NET! Do the adjustments...
6/ Take Rate (cont'd)
Rule of thumb:
- Commission: C2C (low), B2C (high); 3C (low), beauty and apparel (high)
- VAS: payment (50bps) + logistics/fulfillment – by default is a zero margin pass-through (!)
- Ads: high margin
Be careful of what's driving the take rate increase...
Rule of thumb:
- Commission: C2C (low), B2C (high); 3C (low), beauty and apparel (high)
- VAS: payment (50bps) + logistics/fulfillment – by default is a zero margin pass-through (!)
- Ads: high margin
Be careful of what's driving the take rate increase...
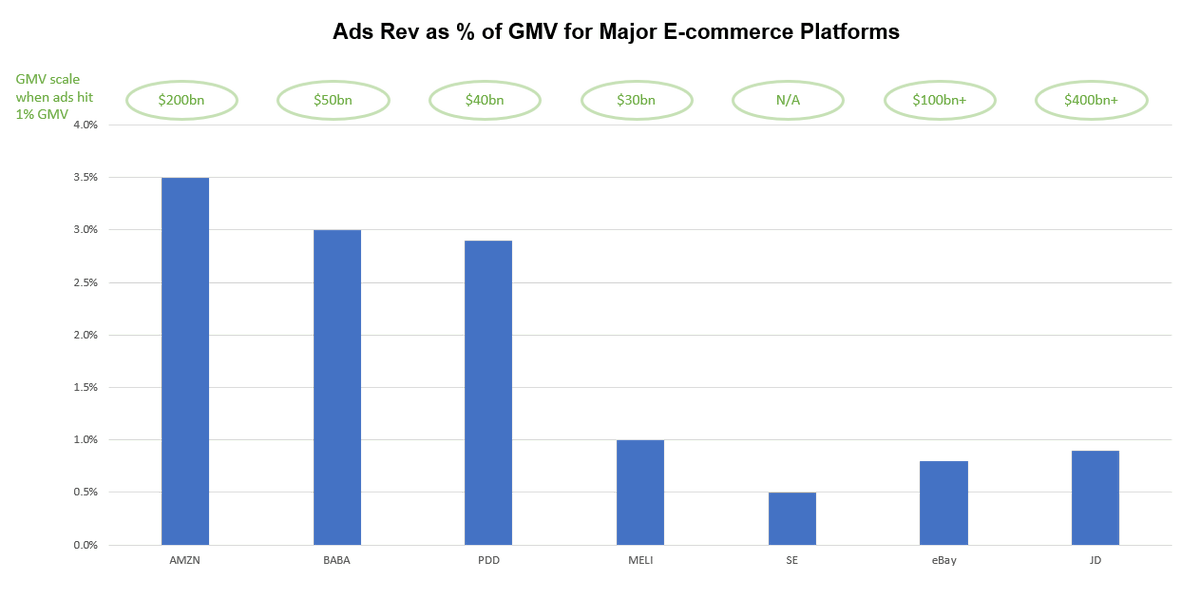
7/ Ads
- Super high margin😍
- Mostly performance ads
- Not available until 1) clear market leadership is established, 2) market is mature/ merchants are educated
- Most platforms hit 1% with $50B+ of GMV
- Super high margin😍
- Mostly performance ads
- Not available until 1) clear market leadership is established, 2) market is mature/ merchants are educated
- Most platforms hit 1% with $50B+ of GMV
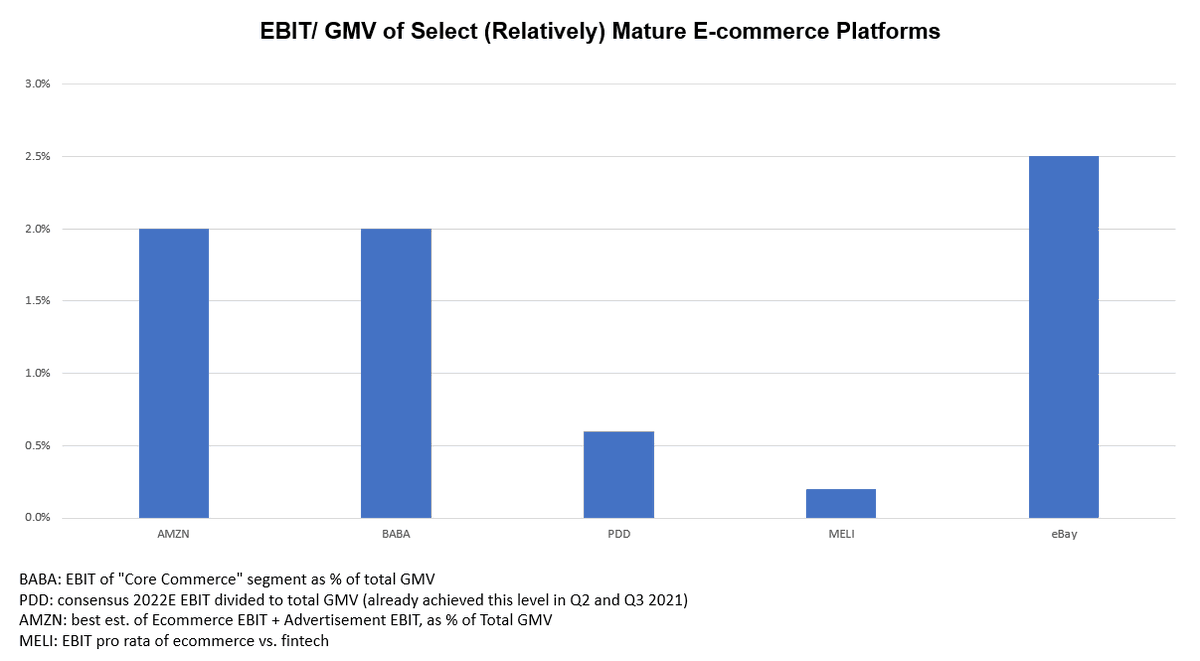
8/ LT Profitability
5% EBIT/ GMV has been the "magic number" most marketplace names (incl. 3P e-comm, food delivery and ride railing) have guided towards
Is it really achievable?🧐
Most mature e-comm platforms seem to be at 2-3% today
(end)
5% EBIT/ GMV has been the "magic number" most marketplace names (incl. 3P e-comm, food delivery and ride railing) have guided towards
Is it really achievable?🧐
Most mature e-comm platforms seem to be at 2-3% today
(end)
• • •
Missing some Tweet in this thread? You can try to
force a refresh


