I've caught a few folks mistakenly interpreting the "pillboxes" at the top of the @unusual_whales flow.
Those are the bits of information above the flow feed itself.
I've labeled them here, A through H to go through them. I'll also explain where some calculations come from.
Those are the bits of information above the flow feed itself.
I've labeled them here, A through H to go through them. I'll also explain where some calculations come from.
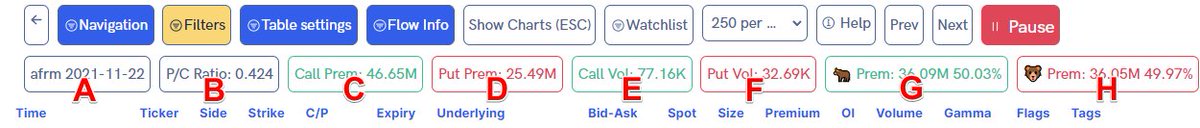
A: Market state shows today's date, along with the single ticker you are viewing. Or just shows "MarketState" if viewing greater than one ticker.
B: Put/call ratio is put volume divided by call volume. Put/call ratio is very important and can be an indication of sentiment shifting.
P/C greater than .7 means more puts are being bought than calls, so the trend is getting bearish.
P/C .7 to .5 is getting more bullish.
P/C greater than .7 means more puts are being bought than calls, so the trend is getting bearish.
P/C .7 to .5 is getting more bullish.
C: Call premium is the total premium for calls traded.
D: Put premium is the total premium of puts traded.
Be mindful! This is TOTAL premium, so sold calls and sold puts are included!
D: Put premium is the total premium of puts traded.
Be mindful! This is TOTAL premium, so sold calls and sold puts are included!
E: Call volume is the total number of calls traded.
F: Put volume is the total number of puts traded.
Again! Both bought AND sold totals here, just like with the premiums!
F: Put volume is the total number of puts traded.
Again! Both bought AND sold totals here, just like with the premiums!
G: Bullish premium is the total of calls bought close to or at the ask and puts sold close to or at the bid.
H: Bearish premium is the total of puts bought close to or at the ask and calls sold close to or at the bid.
These can sometimes confuse folks, so I'll explain further:
H: Bearish premium is the total of puts bought close to or at the ask and calls sold close to or at the bid.
These can sometimes confuse folks, so I'll explain further:
Calls are not necessarily bullish and puts are not necessarily bearish: calls and puts can be bought AND sold.
Call on 🛍️ Ask side = 🐂 Bullish
Call on 🦴 Bid side = 🐻 Bearish
Put on 🛍️ Ask side = 🐻 Bearish
Put on 🦴 Bid side = 🐂 Bullish
...Assuming to open!
Let me explain:
Call on 🛍️ Ask side = 🐂 Bullish
Call on 🦴 Bid side = 🐻 Bearish
Put on 🛍️ Ask side = 🐻 Bearish
Put on 🦴 Bid side = 🐂 Bullish
...Assuming to open!
Let me explain:
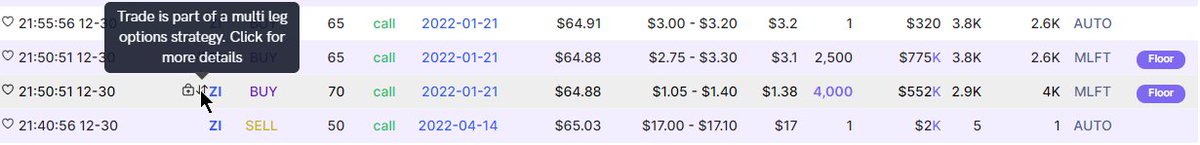
How do you tell if a trade was bought or sold to open?
Trades appended with 🛍️ can be intuited as bought or sold to open.
This determination is made if the size of the trade was greater than the chain's open interest.
Trades appended with 🛍️ can be intuited as bought or sold to open.
This determination is made if the size of the trade was greater than the chain's open interest.
Here is an image pointing to the 🛍️ and the SIZE and OI columns highlighted.
By the way! The exact calculation to make this deduction is:
(size of trade) > (open interest) - ( (volume) - (size of trade) )
So you can check this yourself.
By the way! The exact calculation to make this deduction is:
(size of trade) > (open interest) - ( (volume) - (size of trade) )
So you can check this yourself.

Two final things about BTO/STO!
1. Only trades that can be positively identified as being bought or sold to open will be marked as such (with the 🛍️ symbol).
2. Trades without the 🛍️ symbol might still have been bought or sold to open!
1. Only trades that can be positively identified as being bought or sold to open will be marked as such (with the 🛍️ symbol).
2. Trades without the 🛍️ symbol might still have been bought or sold to open!
So, to repeat... No matter if calls or puts were bought to OPEN or to CLOSE, or sold to OPEN or to CLOSE... they can be bullish OR bearish!
Call on 🛍️ Ask side = 🐂 Bullish
Call on 🦴 Bid side = 🐻 Bearish
Put on 🛍️ Ask side = 🐻 Bearish
Put on 🦴 Bid side = 🐂 Bullish
Call on 🛍️ Ask side = 🐂 Bullish
Call on 🦴 Bid side = 🐻 Bearish
Put on 🛍️ Ask side = 🐻 Bearish
Put on 🦴 Bid side = 🐂 Bullish
And when looking at the flow, the % premiums in the pillboxes or other parts of the flow are taking into consideration the potential SIDE of the trade!
Were the calls SOLD to OPEN 🛍️ at the BID 🦴? Then that is BEARISH 🐻! All calls sold at the bid go into the 🐻 premium totals.
Were the calls SOLD to OPEN 🛍️ at the BID 🦴? Then that is BEARISH 🐻! All calls sold at the bid go into the 🐻 premium totals.
I hope this helped someone.
Please let me know if I can expand on any of these topics in this thread or if you want one topic covered in another thread altogether.
I will gladly continue coaching and educating as much as I can so long as it's useful to someone out there.
Please let me know if I can expand on any of these topics in this thread or if you want one topic covered in another thread altogether.
I will gladly continue coaching and educating as much as I can so long as it's useful to someone out there.
• • •
Missing some Tweet in this thread? You can try to
force a refresh