
A Thread on indicator : ADX
Average Directional Index a Quick Guide
Retweet Share !
@Techno_Charts
1/n
Average Directional Index a Quick Guide
Retweet Share !
@Techno_Charts
1/n
One of the best and easiest ways to increase your chances of making winning trades is to trade with the trend
The average directional movement index or ADX is an indicator that will not help you find a trend,but can show you how strong a trend is
@Puretechnicals9 @StocksNerd
2/n
The average directional movement index or ADX is an indicator that will not help you find a trend,but can show you how strong a trend is
@Puretechnicals9 @StocksNerd
2/n
What is the Average Directional Movement
Index?
1. The average directional movement index was created by J. Welles Wilder in the 1970s.
2. The ADX combines two indicators to create a smoothed moving average that is then shown on your charts.
3/n
Index?
1. The average directional movement index was created by J. Welles Wilder in the 1970s.
2. The ADX combines two indicators to create a smoothed moving average that is then shown on your charts.
3/n
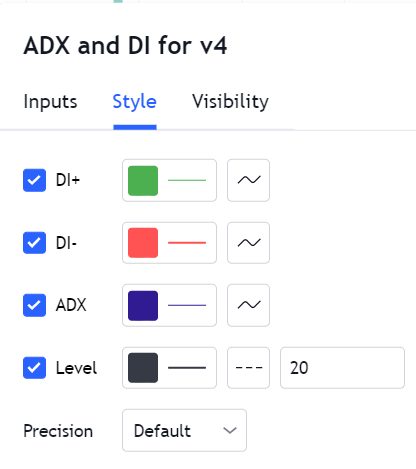
3. The two indicators are the positive directional indicator that is known as +DI and
the negative directional indicator that is known as -DI.
4. You can use the ADX on all time frames
5. Type " ADX " In indicator section of tradingview
4/n
the negative directional indicator that is known as -DI.
4. You can use the ADX on all time frames
5. Type " ADX " In indicator section of tradingview
4/n

The ADX Indicator Formula
These are calculated with the price history of the previous high, low and close for the previous 14 periods ( default 14)
The average directional movement index is designed to show you the strength of a trend and not when a new trend is beginning.
5/n
These are calculated with the price history of the previous high, low and close for the previous 14 periods ( default 14)
The average directional movement index is designed to show you the strength of a trend and not when a new trend is beginning.
5/n

Average Directional Movement Index Reading
● 0 – 25: Ranging or no trend
● 25 – 50: Trending
● 50 – 75: Strong Trend
● 75 – 100: Very Strong Trending Market
6/n
● 0 – 25: Ranging or no trend
● 25 – 50: Trending
● 50 – 75: Strong Trend
● 75 – 100: Very Strong Trending Market
6/n


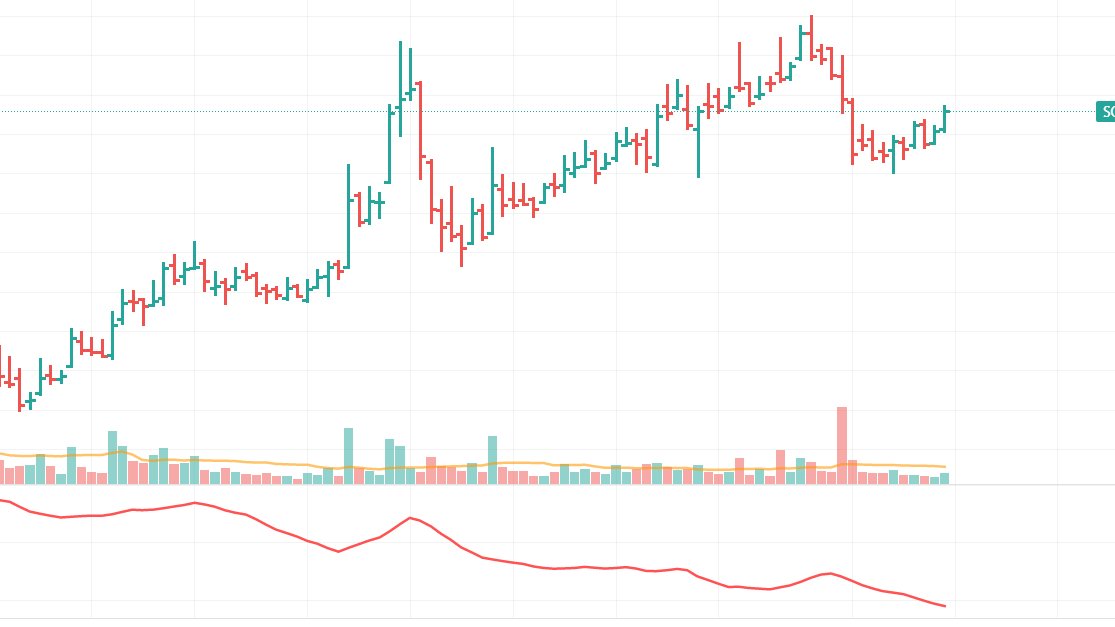
When you have the ADX plotted on your chart you will see one main reading that moves higher and lower. This visually shows you the peaks and troughs of the
trends momentum.
When you begin seeing larger readings over 25 you can quickly identify that price is in a trend.
7/n
trends momentum.
When you begin seeing larger readings over 25 you can quickly identify that price is in a trend.
7/n


When the average directional movement index is making a series of lower readings you can see that price has little momentum.
This also indicates you may want to look for trades other than trend trades.
Use Line tool to mark the 25 level to identify trend change @kuttrapali26
This also indicates you may want to look for trades other than trend trades.
Use Line tool to mark the 25 level to identify trend change @kuttrapali26

Join telegram for free
t.me/Techno_charts
Join Paid Group at 300 Per month
app.cosmofeed.com/view_group/619…
t.me/Techno_charts
Join Paid Group at 300 Per month
app.cosmofeed.com/view_group/619…
• • •
Missing some Tweet in this thread? You can try to
force a refresh


