West Ham publish financials for year ended 31 May 2021: Key numbers
Revenue up 38% to a record £193m despite Covid.
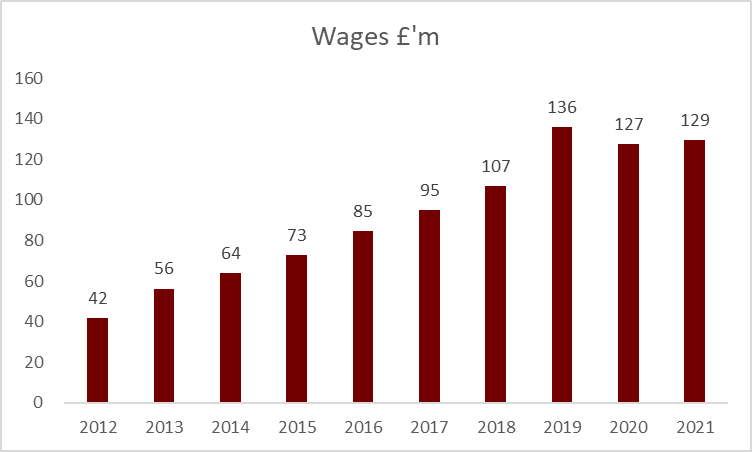
Wages little change
Day to day losses down from £80m to £26m
Net transfer spend minus £3m
Borrowings down £11m to £109m #WHUFC
Total revenue up as broadcast increase due to more matches in period 1 June 2020-31 May 2021 than previous year. This offset decrease in matchday income. Gap to the Sneaky Six still huge though. #WHUFC
Broadcast income almost doubled due to more matches being played so be cautious when comparing to 2019/20 as many matches postponed due to Covid. Good by standards of 'Other 14' but still some catching up to do on you know who.
Matchday revenue just £508k due to Covid compared to nearly £26m previous season. Should bounce back in 2021/22 due to matches in front of paying audience, increased capacity and participation in Europe. #WHUFC
Commercial income down over £6m although merch sales did rise to partially compensate for this.
Wages cost up slightly (2020 figures included compo for Pelligrini so stripped out here) #WHUFC still below the wage level of a small club such as Crystal Palace although Palace's covered 13 months. Average weekly wage just over £60k
West Ham paid £67 in wages for every £100 of income, below UEFA's red line of £70 and a big fall from previous season. #WHUFC
Highest paid director at #WHUFC had a £300k pay rise. I wonder who was the lucky recipient?
Other main player cost is transfer fee amortisation (fee divided by contract period) has been broadly static for the past three years. Mid table by PL standards
West Ham had transfer fee impairments (writing down transfer value having signed someone a bit bobbins) of £9.9 million in 2020/21.
As a result of all the above West Ham had a day to day loss of £26m in 2020/21, down from £80m previous season. Losses of £1/2m a week turn out to be quite low by PL standards. #WHUFC
Losses can be offset by player sales and owner investments. West Ham made profits of £18m in 2020/21 #WHUFC
West Ham owners earned £1.87m from loans to the club in 2020/21 taking the total to £22.5 million in the last decade #WHUFC
West Ham had player signings of £54m in 2020/21 offset by sales of £57m. The squad cost fell to £259m
West Ham borrowings fell slightly to £109m due to share issue of £30m in the year.
A history of Premier League transfer spending. First season (1992/93) total spend was £65m and QPR spent just £197k. Newly promoted Blackburn were the biggest spenders due to Jack Walker's investment in the likes of Alan Shearer, Stuart Ripley, Kevin Gallagher & Graham Le Saux.
1993/94 spending up to £78m. Blackburn continue to be the biggest spenders, Champions Manchester United were outspent by...err...Swindon.
First £100m spend season, Everton became the first team to eight figures spent in a season with Ferguson, Samways, Amokachi and Barrett all joining the club on big deals. QPR again smallest spenders. Man City and Chelsea outspent by Wimbledon.
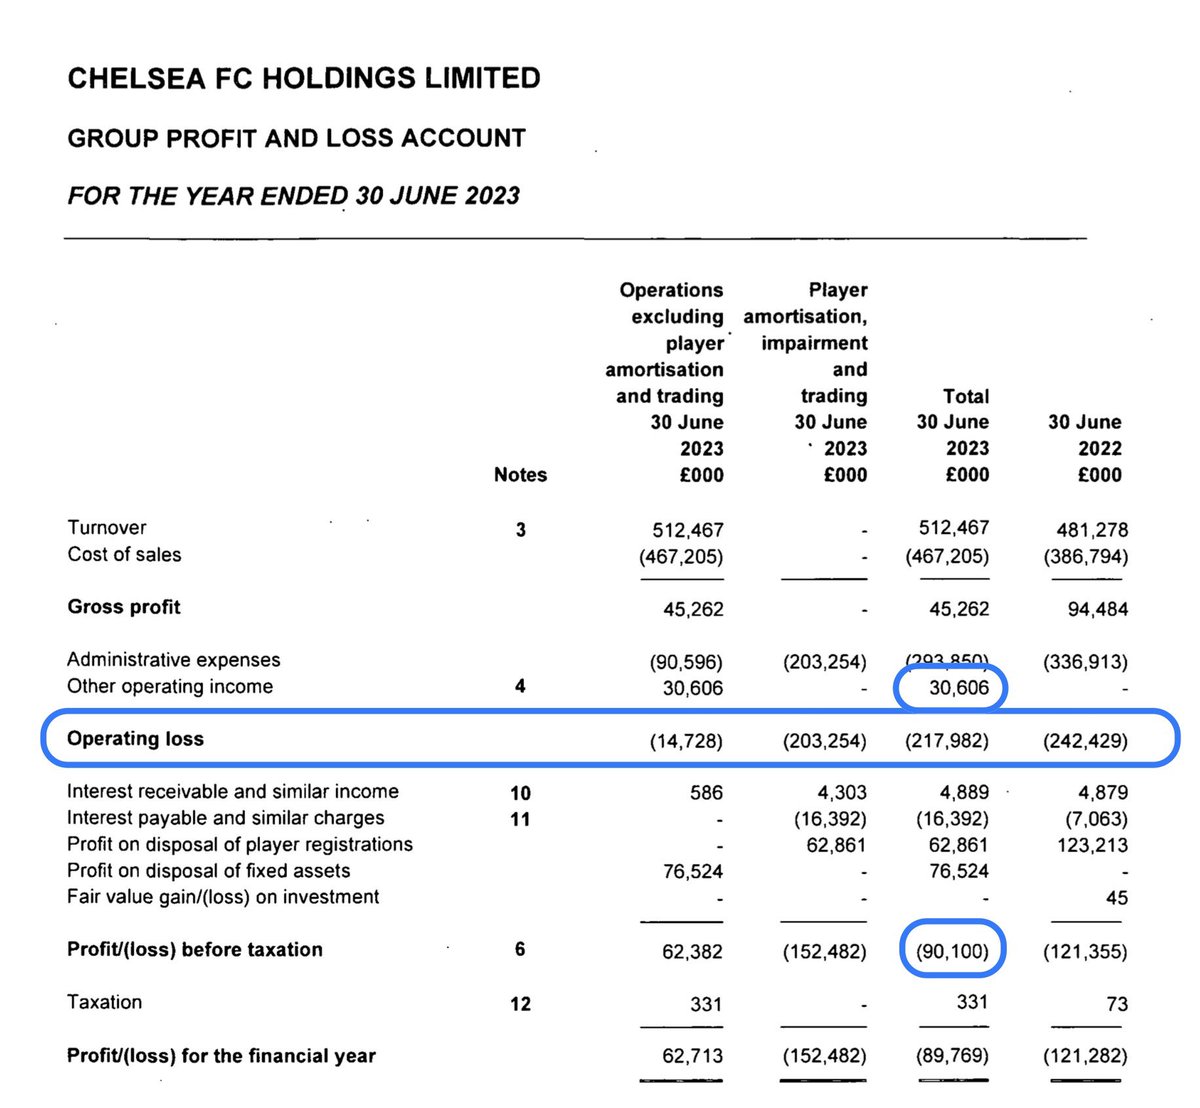
Chelsea FC Holdings submit 22/23 accounts. 🔑 figs
⚽️Revenue £512m ⬆️ 6%
⚽️Wages £404m ⬆️ 18%
⚽️Player costs (wages & amortisation) £119 for every £100 of revenue
⚽️Day to day losses £249m
⚽️Player purchases £745m
⚽️Player sales £203m
⚽️Borrowings in year £428m
Losses ⬆️ from £242m to £249m for day to day running of club but sale of hotel to another part of group, £30m of financial settlements & player sales ⬇️ this to £90m
Chelsea have cash in bank, total losses adding all the years together now £1.135 billion
Whilst #Rovers 🔑 revenue streams, matchday, broadcast & commercial all ⬆️ significantly. However general overheads ⬆️ too which meant no change to op losses. Sale of Armstrong in 21/22 halved losses
Both accounts & audit report reference that there is a material uncertainty over ability of club to trade as a going concern. Should no noted that audit report dated December 2023 & things may have improved since then
Burnley publish 22/23 accounts; 🔑 figs
Revenue £65m ⬇️ 47%
Wages £54m ⬇️ 42%
Loss pre player sales £41m
Player purchases £84m
Player sales £21m
Borrowings £101m
Big change in pre tax profit of £36m in 21/22 to a loss of £36m in 22/23. Mainly due to ⬇️ in revenue following relegation and player sale profits ⬇️ from £54m to £11m.
Burnley still have substantial cash but this due to the Club borrowing substantial amounts during the year as liabilities ⬆️. Burnley still profitable over the years.
Leicester announce 22/23 accounts for 13 months to 30 June. 🔑 figs
Revenue £177m ⬇️ 17%
Wages £206m ⬆️ 13%
Loss pre player sales £152m ⬆️ 91%
Player sale profits £75m
Player purchases £53m
Player sales £104m
Extending financial year from 31 May to 30 June allowed Leicester to squeeze in sales of Maddison but pre tax loss (start point for PSR) still £90m.
Leicester total losses over the years now £295m. Liabilities ⬇️ after owner converted loans into shares.
Everton publish 22/23 accounts: 🔑 figs
Revenue £172m ⬇️ 5%
Wages £159m ⬇️ 2%
Amortisation £77m ⬆️ 23%
Manager/coaching payoff £7m
Executive payoff £2.5m
Loss pre player sales £130m
Pre tax loss £89m
Player signings £91m
Player sales £61m
Borrowings £341m
Losses ⬆️ due to no longer having Usmanov sponsor deals, wage ⬇️ modest & interest costs doubling
Cash balance down as club dealing with significant monthly demands in terms of meeting payroll and new stadium costs. Total losses over the years now £550m