1. A short #flu 𧡠
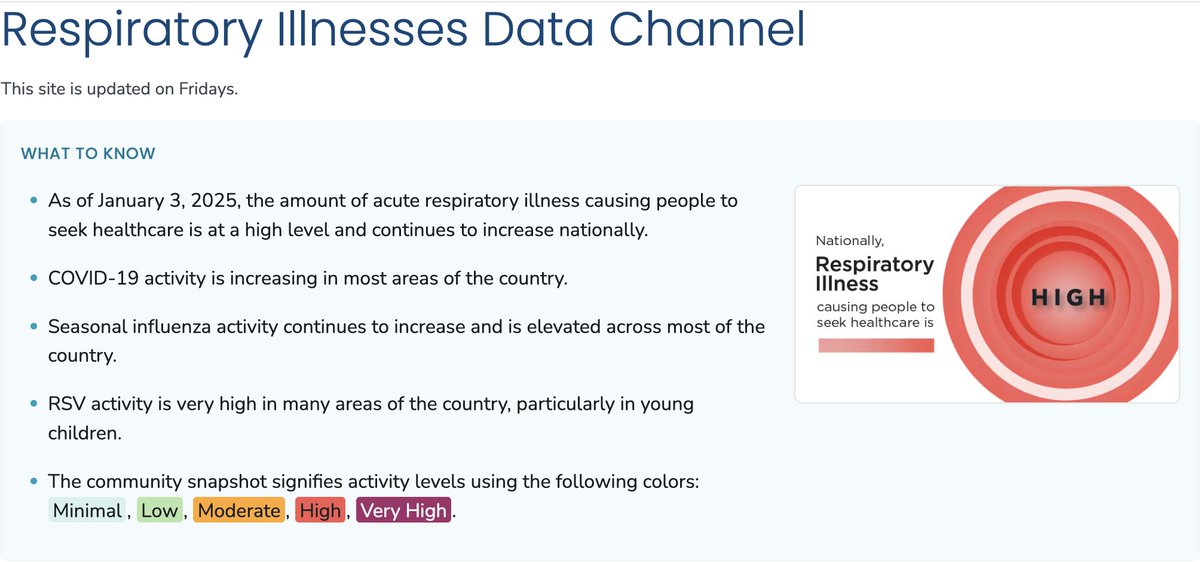
@CDCgov posted flu data for the week ending Dec. 25 today. Flu activity continues to increase, but remains at lower levels than in pre-pandemic years.
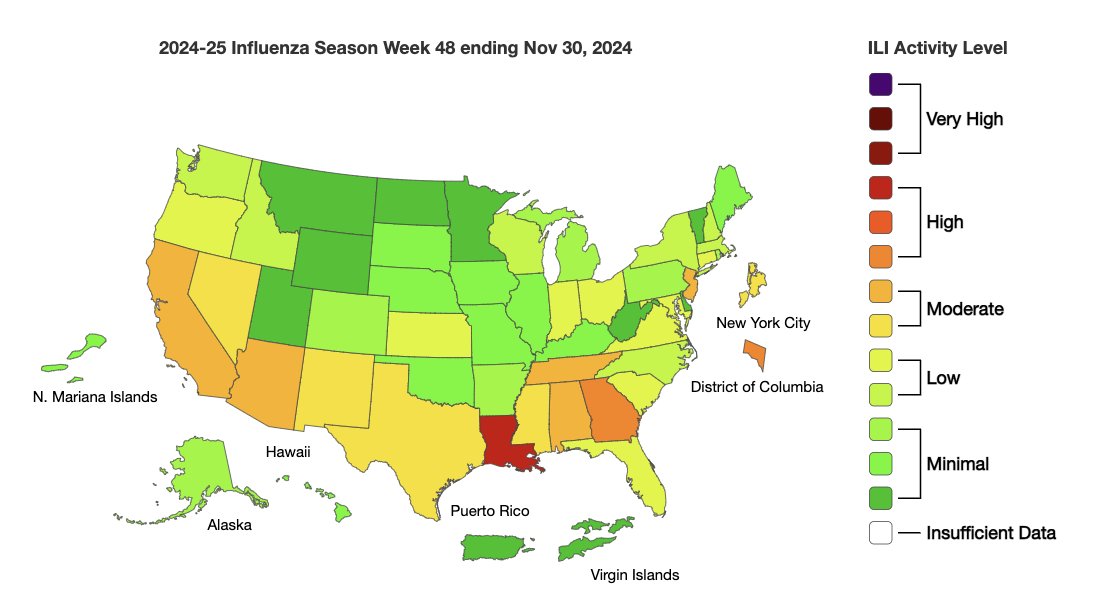
Most diagnosed flu infections are in 5-24 year olds. Flu activity is highest in the east & central US.
2. Virtually all #flu activity so far has been caused by the #influenza A virus H3N2. That's too bad as it is the most problematic of (human) flu A & B viruses. There's a mismatch this year this year in the H3 component of flu shots. (Week 51, left column, season to date, right.)
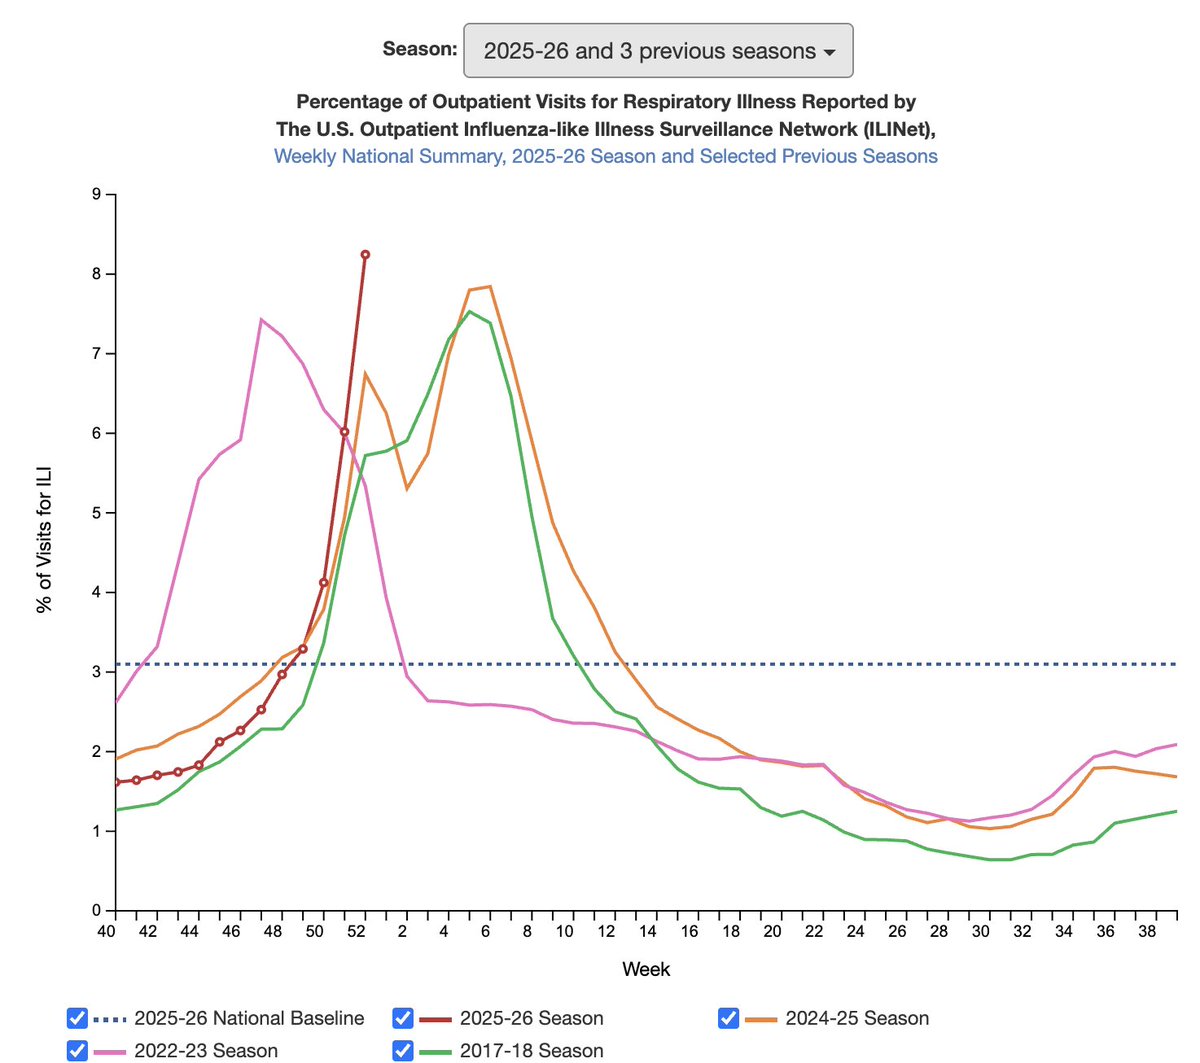
3. For the week ending Dec. 25 (week 51), 6.2% of tests run by clinical labs were positive for flu. I think the last time it would have been that high was the week ending March 21, 2020 (6.9%), when the very active 2019-20 flu season ran smack dab into Covid β and promptly ended.
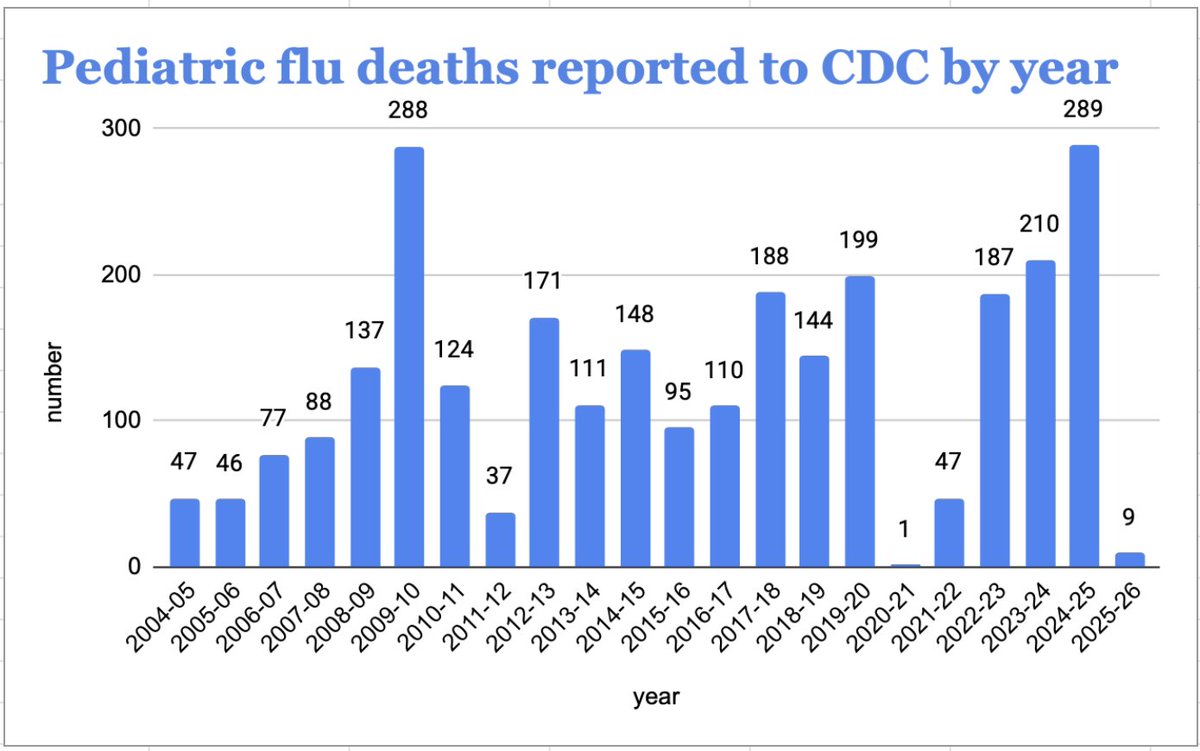
4. #Flu seasons start & peak at different points, so it can be hard to compare a week in 1 flu season to the corresponding week in another. So here's a chart to show how a positivity rate of 6.2% corresponds to other years at this time.
5. In #flu seasons that start early, the positivity rate by week 51 can be above 20%. Last year's non-season doesn't even register here. The 2015-16 season was pretty atypical: mild flu season that only peaked in late March.
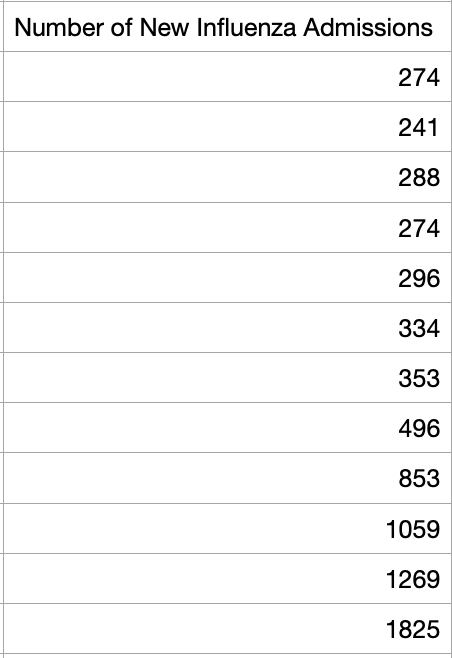
6. A thing to note: While it's possible this #flu season will be less active than pre-pandemic seasons, any flu illness is right now is very unwelcome. Health systems are strained to the max with #Covid. There aren't spare hospital beds; but flu hospitalizations are rising.
7. If you want to look at the data, FluView can be found here. cdc.gov/flu/weekly/
β’ β’ β’
Missing some Tweet in this thread? You can try to
force a refresh
1. FluView for the week ending 2/8 is out; let's take a look.
This has been a very full-on flu season β the worst since well before the #Covid pandemic. @CDCgov says 2024-25 is now classified as a severe season, the first since the very bad 2017-18 season. Red arrow this year, blue arrow 2017-18.
2. In the week ending Feb 8, 46 states reported "very high" or "high" #flu activity. Someone needs to explain Montana to me. It has seemingly completely avoided a flu season that has raged elsewhere.
3. This #flu season marked a first since #Covid19 entered our world. Since late January, flu deaths have exceeded Covid deaths. @CDCgov estimates that so far this year there've been at least 29M flu illnesses, 370K hospitalizations & 16K deaths.
1. @CDCgov posted FluView today after holding it back on Friday because of the incoming folks' communications pause. At some point I'd love for someone to try to make sense for me the strategic relevance of withholding flu season data.
Anyway, it's out. A 𧡠cdc.gov/fluview/surveiβ¦
2. #Flu activity had started to decline in the 2nd week of January, but it was climbing again in the week ending 1/18. 15 jurisdictions had very high flu activity; 24 had high. Montana seems to be having a very light flu season; not sure why that would be.
3. Four more pediatric #flu deaths were reported to @CDCgov, bringing this year's total to 31 so far. Far below last year's gruesome tally, but the season isn't over yet. And 31 families are going through a whole lot of heartache.
(Data CDC's; chart mine)
1. A #flu & other respiratory bugs update:
This year's flu season was pretty much exquisitely timed to coincide with the holidays, a great way to spread respiratory illness across the various age groups. Right now there's lots of flu, lots of #RSV & #Covid is on the rise again.
2. Check out the difference 1 month made. The map on the left shows #flu activity at the end of November, just after Thanksgiving. The map on the right shows the situation as of Dec. 28. The darker the color, the more flu-like illness making the rounds.
3. For the week ending 12/28, the percentage of outpatient visits for #influenza like illness (red arrow) was near the peak of activity in 2019-20, though that season (dark blue line) had 3 peaks. We're still below the peaks of 2022-23 (pink) & 2017-18. Will we have a 2nd peak? Maybe.
1. Some thoughts on #H5N1 #birdflu in cows. A π§΅
A bunch of new herds were announced by a couple of states today βΒ Colorado and Iowa. The former reported +5 & looks like it may have another pending; It now has 18 in total, maybe 19. Iowa reported 2 more, taking it to 10.
2. To the best of my ability to keep up βΒ and that's being challenged β I think there have been 125 herds reported in 12 states since the end of March. This graph combines @USDA's numbers from yesterday with the newly reported herds from Colorado & Iowa.
3. But @USDA threw a wrench into the works today. It updated its exceedingly wonky #H5N1 #birdflu in cows landing site. Some things work better, but the cumulative number of herds was lowered by 4 (from yday) with no explanation. USDA now says 112 herds in 12 states.
1. @USDA posted an FAQ today about the federal order restricting movement of dairy cattle infected with
#H5N1 #birdflu. Interesting information therein.
A π§΅
New to me: USDA says 8 poultry operations in 5 states have had poultry outbreaks with the virus detected in cows.
2. Minnesota hasn't reported #H5N1 #birdflu in cattle, but it has had at least 1 poultry outbreak with the cattle virus, @USDA reveals. More evidence, probably, that the virus is far more widely spread than has been realized. The FAQ is here: aphis.usda.gov/sites/default/β¦
3. The federal order on the movement of dairy cows goes into effect 4/29. @USDA is setting what looks like an ambitious timeline for processing of tests, especially "non-negative" tests that must then go for confirmatory testing at the USDA lab in Ames, Iowa. #H5N1 #birdflu
1. Listening to an @ASTHO - @IDSAInfo - @CSTEnews webinar on #H5N1 #birdflu in cows.
Of interest so far:
β @USDA is monitoring feral swine; no detections of H5 so far.
β in the "small number" of samples tested to date, doesn't look like cows are shedding virus thru feces.
2. @USDA Rosemary Sifford said the infections are "mostly" being seen in lactating herds.
1 herd was found to be positive despite the fact there were no clinical signs among the cows.
Sifford said USDA doesn't yet know how long infected cows shed virus.
#H5N1 #birdflu
@USDA 3. Sonja Olsen from @CDC says there've been 6 infections detected in cats on dairy farms. Not sure I've seen the exact number. #H5N1 #BirdFlu