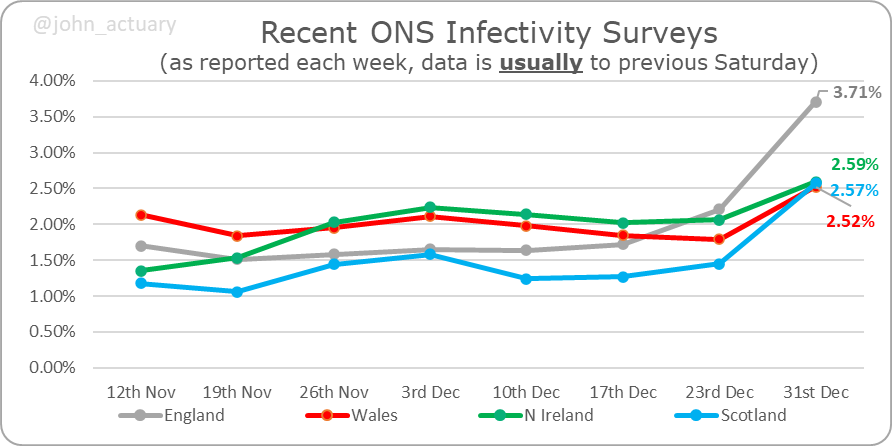
ONS has released its infection survey results early this week, and they show a big, y-axis changing, jump for the week ending 31st Dec.
E ⏫from 3.7% to 6.0%
W⏫from 2.5% to 5.2%
NI⏫from 2.6% to 4.0%
S⏫from 2.6% to 4.5%

In E, 3.3m are estimated to have been infected.

1/
In London the modelling estimates that prevalence peaked on Xmas Day and is now falling back, albeit more slowly than it rose. That's good news, but...

...we also need to look at the age profile of London though.

2/
Here we see a slightly less optimistic picture, with infections at older ages continuing to rise towards the year end, although even the oldest ages appear to peak by the 31st, so hopefully it's downhill across all ages in the new year.

3/
By region we can see that London was still the highest last week, but the NW was not far behind. It's likely that has reversed by now though.

4/
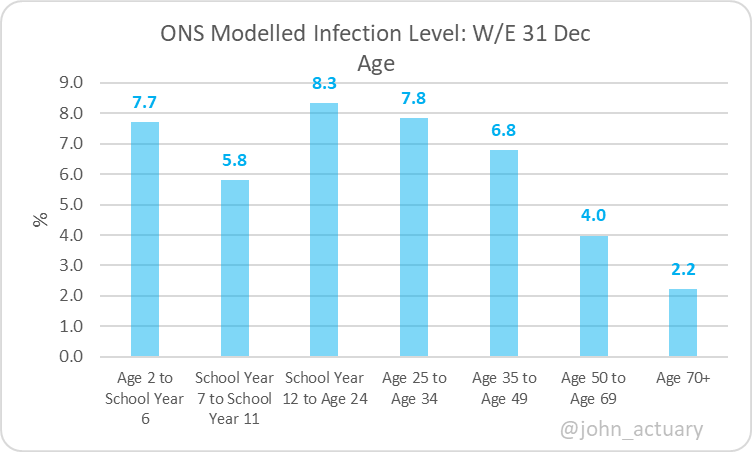
By age it's noticeable that Yr 7-11 has a lower prevalence than the bands either side. Other than that, it's a familiar picture, with prevalence falling as age increases.

5/
We see here how Omicron has usurped Delta rapidly in the space of around 3 weeks, amounting to close to 90% of the cases in England.

6/
Although these data are to the 31st, the single figures quoted are the average for the week (28th), and so if rates are continuing to increase then they are likely to underestimate the position by the 31st (the converse is true during a falling period).

7/
A reminder that these are randomly sampled PCR tested data, and issues around testing availability, delays in obtaining results etc will not influence the results.

Report here:
8/8
ons.gov.uk/peoplepopulati…

• • •

Missing some Tweet in this thread? You can try to force a refresh
 

Keep Current with John Roberts

John Roberts Profile picture

Stay in touch and get notified when new unrolls are available from this author!

Read all threads

This Thread may be Removed Anytime!

PDF

Twitter may remove this content at anytime! Save it as PDF for later use!

Try unrolling a thread yourself!

how to unroll video
  1. Follow @ThreadReaderApp to mention us!

  2. From a Twitter thread mention us with a keyword "unroll"
@threadreaderapp unroll

Practice here first or read more on our help page!

More from @john_actuary

5 Jan
Latest COVID CH deaths (to 31st Dec) show a marked increase in comparison to previous weeks, undoing much of the reductions we saw in the previous two months.

As usual, we don't have vax status, nor whether COVID was the primary cause of death.

1/
In contrast, Over 70 deaths (to 24th Dec - a week earlier) show a steeper fall after three more gradual steps downwards. (Overall registrations are up, so there doesn't appear to be a holiday effect involved in the fall.)

2/
You can see here how the proportion of Over 70 deaths fell in the Spring as the initial vax effect benefited older ages first, then reverted to some degree as other age groups benefited too, and more recently has fallen again with the booster effect kicking in first.

3/
Read 4 tweets
4 Jan
The first neat "summary on a page" of latest hospital data from @COVID19ACtuary this year shows hopeful signs in London, but still rapid growth elsewhere.

Next, weekly growth figures for admissions/beds/ mech ventilator beds.

1/
You can see clearly here how London is now the slowest region for growth over the last week, and indeed, the latest two admissions days have been lower than a week ago.
The green bars remain relatively low too across all regions, which is positive.

2/
A different view here, showing how London growth (on a rolling 7 day basis) took off earlier, but at the same time as others followed, it started to slow, and is likely to turn negative shortly.

Other regions are still growing rapidly, NE/Yorks being the fastest.

3/
Read 4 tweets
3 Jan
Bank Holiday🏴󠁧󠁢󠁥󠁮󠁧󠁿booster/3rd primary update:
260k total reported over the last three days A comparison with the prior week isn't really meaningful, but in total we've boosted just 1.6m in the 10 days from 24th to 2nd.

Total is now 28.7m.

1/ Image
We may have offered all adults a booster by the year end, but around 8.7m (pale blue bars) haven't yet had one for some reason.

Note that some will be due to lack of interest, and some due to recent or current infections, rather than a lack of capacity in the system.

2/ Image
Nevertheless we've got excellent coverage over age 50, with 91% of those eligible boosted, or 89% of all those with 2 doses.

Put another way, only 1.8m of those eligible over 50 haven't yet been boosted - but we do need to reach out to these people, and get them jabbed too.

3/ Image
Read 7 tweets
31 Dec 21
On the day the Health Sec announces that the target to offer everyone over 18 a booster (if eligible) by the year end has been met, let's take a look at progress.

321k reported today, down a third on last week.

Total is now 28.4m.

1/
There are still just under 9m who are eligible and yet to be jabbed. Even if we assumed only 90% want to come forward, that would leave around 5m still waiting, predominately U50s.

Many of course will have a recent positive test, so are unable to come forward at the moment.

2/
In total, around 76% of those eligible have been boosted - and where it really matters, over age 50, it's 91%, which is a really good performance.

3/
Read 8 tweets
31 Dec 21
An abbreviated ONS Infection Study update, shows the dramatic increase seen just before Xmas.

E is about 40% higher than the devolved administrations, which is likely to be partly due to the high prevalence in London.

Data are for week ending 23rd Dec.

1/
Note that, as usual, the figures are the average over the week. We usually have the daily time series to determine the latest date (likely to be higher during rapid growth), but they're not available this week.

It's estimated that over 2m people in E were infected.

2/
The continued rise in Omicron is charted here. Remember this is overall infections, not just new incidences, so will lag the incidence data which shows Omicron even more dominant now.

3/
Read 6 tweets
31 Dec 21
We now have the primary diagnosis (PD) update for England. Of those in hospital with COVID, there's been a continuing fall of the % for whom COVID is the PD.

In London the fall is even more marked.

I discuss why this is to be expected here.


1/
It doesn't mean we're not seeing a steep increase in hospital numbers for whom the PD is COVID though. Here's the position for England, with a 30% increase in 3 days from the 25th to 28th (since which overall occupation has risen a further 20%).

2/
And here's the equivalent regional picture, with the sharp increase in London very clear (up 42% in a week)
Again, London has risen a further 15% since the 28th, but we don't have a PD % to match the last two dates with.

3/
Read 5 tweets

Did Thread Reader help you today?

Support us! We are indie developers!


This site is made by just two indie developers on a laptop doing marketing, support and development! Read more about the story.

Become a Premium Member ($3/month or $30/year) and get exclusive features!

Become Premium

Too expensive? Make a small donation by buying us coffee ($5) or help with server cost ($10)

Donate via Paypal

Or Donate anonymously using crypto!

Ethereum

0xfe58350B80634f60Fa6Dc149a72b4DFbc17D341E copy

Bitcoin

3ATGMxNzCUFzxpMCHL5sWSt4DVtS8UqXpi copy

Thank you for your support!

Follow Us on Twitter!

:(