
Suomen epidemia 5.1.2022: testien jonotusajan nousulla korjattu tartuntojen määrä osoittaa jyrkän kasvun jatkuvan. Tartuntojen näkyvyys 30.12. jälkeiseltä ajalta on huonontunut.
1/x
1/x

Jonotusaika testeihin on kasvanut voimakkaasti. Jonotusajan nousu alkoi joulun jälkeen. Pääkaupunkiseudulla, jossa on noin puolet koko maan todetuista tartunnoista, jonotusaika testiin oli tänään 4-6 päivää.
2/x
2/x

Tämä tarkoittaa sitä, että henkilö, joka testataan tänään, on saanut tartunnan jo monta päivää aikaisemmin. Kun tartuntoja korjataan jonotusajan muutoksella, tartunnat kasaantuvat samoille päiville joulukuun loppuun.
3/x
3/x

Tulos: arvioitu päivittäisten tartuntojen määrä on kohonnut 30.12. jo yli 10.000:n tasolle. Vaikka kasvuprosentin nousu on hieman hidastunut 27.12. jälkeen, arvioitu kasvu on noin 13.3% päivässä = power(1.133,30)= 42x kuukaudessa.
4/x
4/x

Tässä käytetty jonotusaika. Jos esimerkiksi halusi tänään varata testin Espoossa niin ajan sai ensi viikon tiistaille (11.1.), ja THL:n tietokannassa näytteenottopäiväksi tulee siis 11.1. Jos tätä viivettä ei korjata, niin tartunnoista syntyy aivan liian optimistinen kuva.
5/x
5/x

Omicron on aiheuttanut sen, että Ihmiset menevät omaehtoiseen lockdowniin viranomaisista huolimatta. Sama kuin keväällä 2020.
6/x
thx @enjoyingthewind
6/x
thx @enjoyingthewind
https://twitter.com/greg_travis/status/1478789756167278596
Rokotusten määrät näyttävät lässähtäneen. Mitään nousua rokotuksien määrissä tammikuussa ei ole toistaiseksi raportoitu.
7/x
7/x

Rokotusten antaminen pysähtyi joulun ja uuden vuoden välillä lähes täysin, vaikka kiire piti olla. Siitä toivuttiin vähän, mutta nyt mennään taas käsittämättömästi alaspäin.
8/x
8/x

Nyt on tultu siihen, että tuomioistuimet ovat viemässä aluehallintoviranomaisilta toimivallan. Tuomioistuimista näyttää olevan tulossa Suomen ylin päättävä elin korona-asioissa.
9/x
kaleva.fi/hallinto-oikeu…
9/x
kaleva.fi/hallinto-oikeu…

HYKS erityisvastuualueella sairaanhoidossa olevien määrä on kaksinkertaistunut jouluaaton jälkeen. Kasvuvauhti on 6.4 prosenttia päivässä = 6.5x kuukaudessa.
10/x
10/x

Koko maassa sairaanhoidossa olevien määrä on 26.12. jälkeen noussut 4.8 prosenttia päivässä = 4.1x kuukaudessa. Nopeimmin on noussut vuodeosastoilla hoidettavien määrä; teho-osastolla olevien määrä on vähentynyt.
11/x
11/x

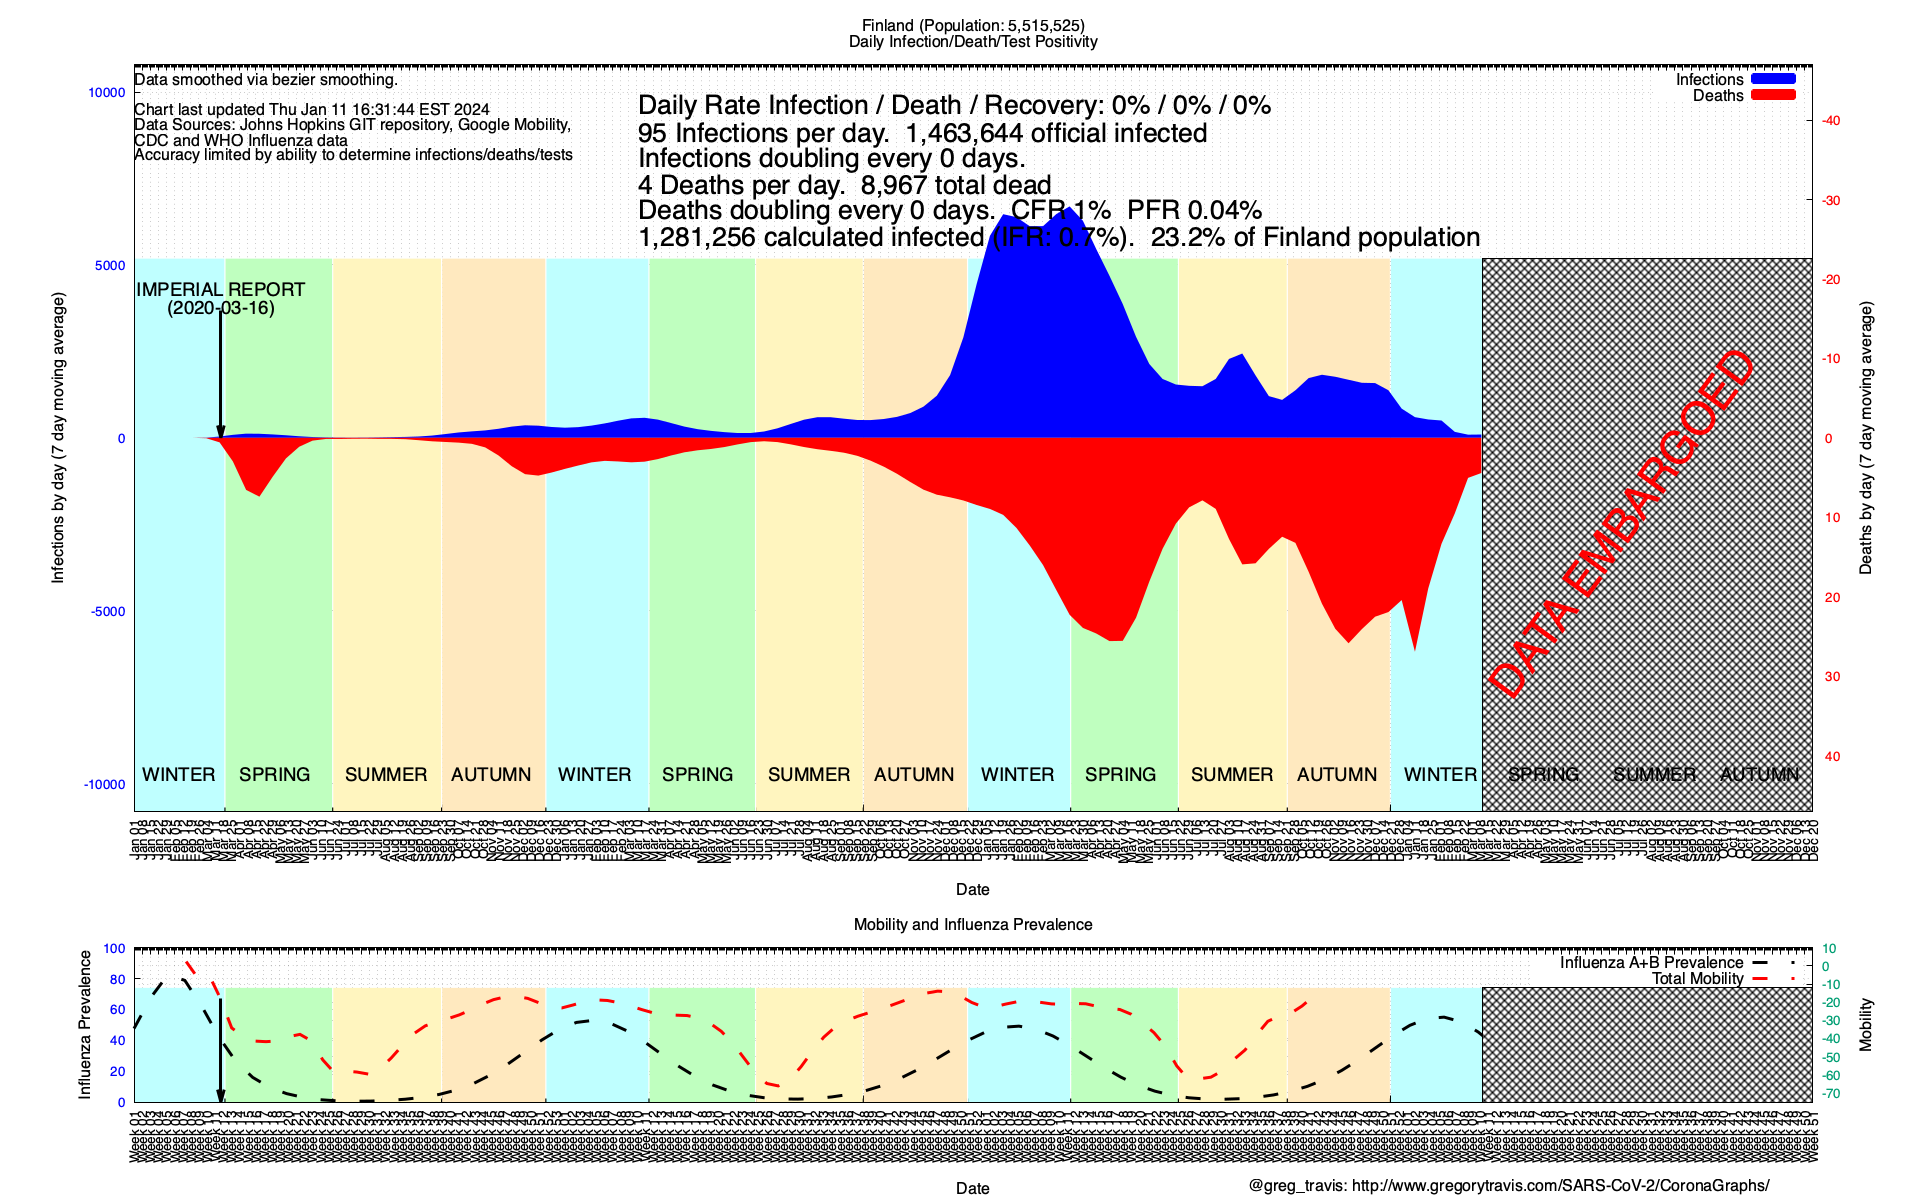
Tässä hyvä kuva. Tämän mukaan influenssa-aalto on jäänyt jopa viime vuotta alemmalle tasolle, ja ihmisten mobiliteetti vähenee jyrkästi parhaillaan.
12/x
thx @enjoyingthewind
gregorytravis.com/SARS-CoV-2/Cor…
12/x
thx @enjoyingthewind
gregorytravis.com/SARS-CoV-2/Cor…

• • •
Missing some Tweet in this thread? You can try to
force a refresh


